Let’s Meet, on Your Terms
No pressure, no obligations — just an open conversation about your goals.


Higher Rates Are Another Hurdle for the U.S. Economy
After a strong recovery in financial markets in the second quarter from the geopolitical volatility that defined the start of the year, market choppiness returned in Q3, this time concentrated in bond markets. With the conflict in Iran ongoing and refining disruptions keeping energy prices elevated, inflation has stayed well above the Fed’s target. In September, the central bank raised interest rates for the first time since the summer of 2023. Markets continue to price in additional hikes in 2027, and long-term yields have moved sharply as a result, with the 10-year treasury yield reaching its highest level in over 2 decades. This has weighed on fixed income indices and raised concerns that higher borrowing costs could weigh on the economy and thus equity markets.
However, economic data has so far remained resilient. Consumers have continued to show their strength despite higher prices at the pump, and business investment remains supported by artificial intelligence supporting capital expenditures. The labor market has similarly been robust despite a slowdown in job creation, as unemployment has remained in a tight range with little evidence of broad-based layoffs. In our view, much of the inflationary pressure has been concentrated in energy rather than spreading across the broad economy like we saw in the post-COVID recovery. While another cycle of interest rate increases will be another test of the US economy’s resilience post-COVID, we continue to believe that the strength of the consumer and demand stemming from the Artificial Intelligence buildout should keep the economic expansion alive.
Interest Rates Reach Multi-Decade Highs as Energy Drives Inflation Higher
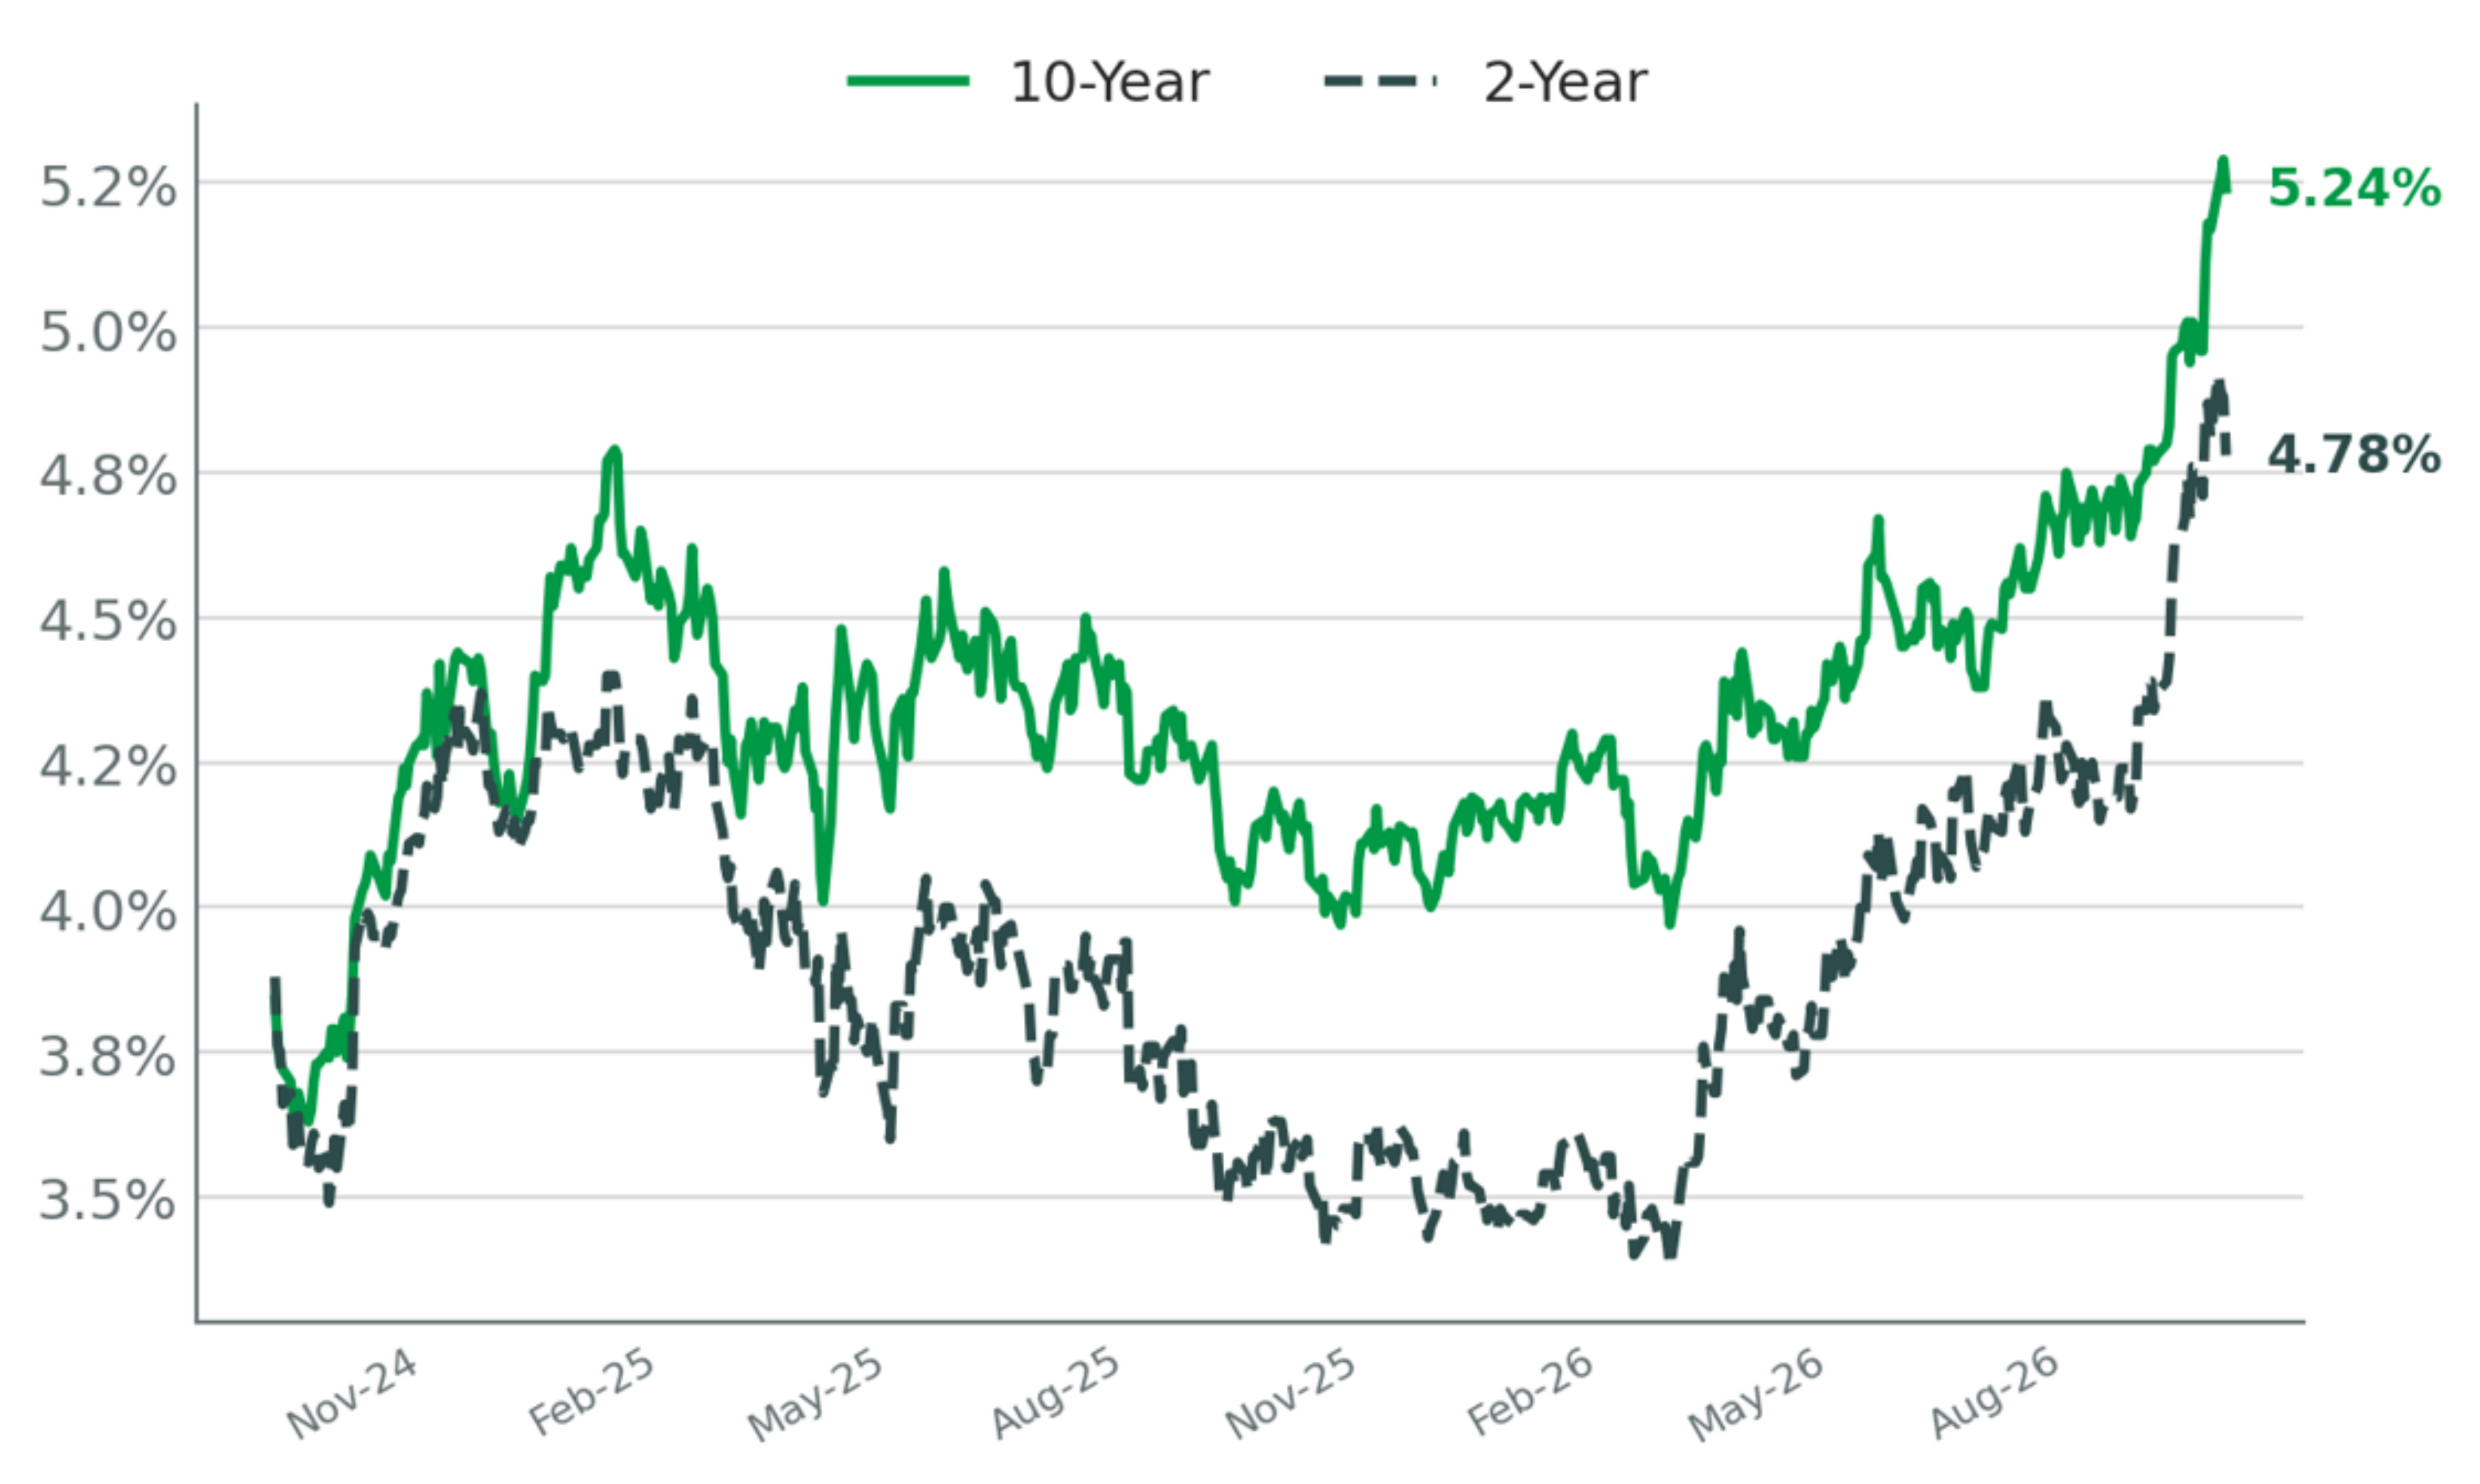
After reaching close to 4% in late February, the 10-year Treasury yield has persistently climbed higher over the year, reaching 5.3% in early October – the highest level since 2002. This move was most acute in September as continued disruptions in energy markets, persistently elevated inflation, and a resilient labor market prompted the Federal Reserve to raise interest rates for the first time in over 3 years.
10 & 2 Year Treasury Yields
Source: YCharts. As of 10/1/2026.
As shown above, both the front and long end of the curve moved higher over this period as the market rapidly repriced expectations for short-term rates. Despite expectations for Chairman Warsh to move rates lower when he took office as chairman of the Fed in May, the market is now pricing in continued hikes, with current market probabilities pointing to a 4.75-5.00% Fed Funds rate by the summer of 2027 (4 hikes of 25 basis points from today’s 3.75-4.00% target)[1].
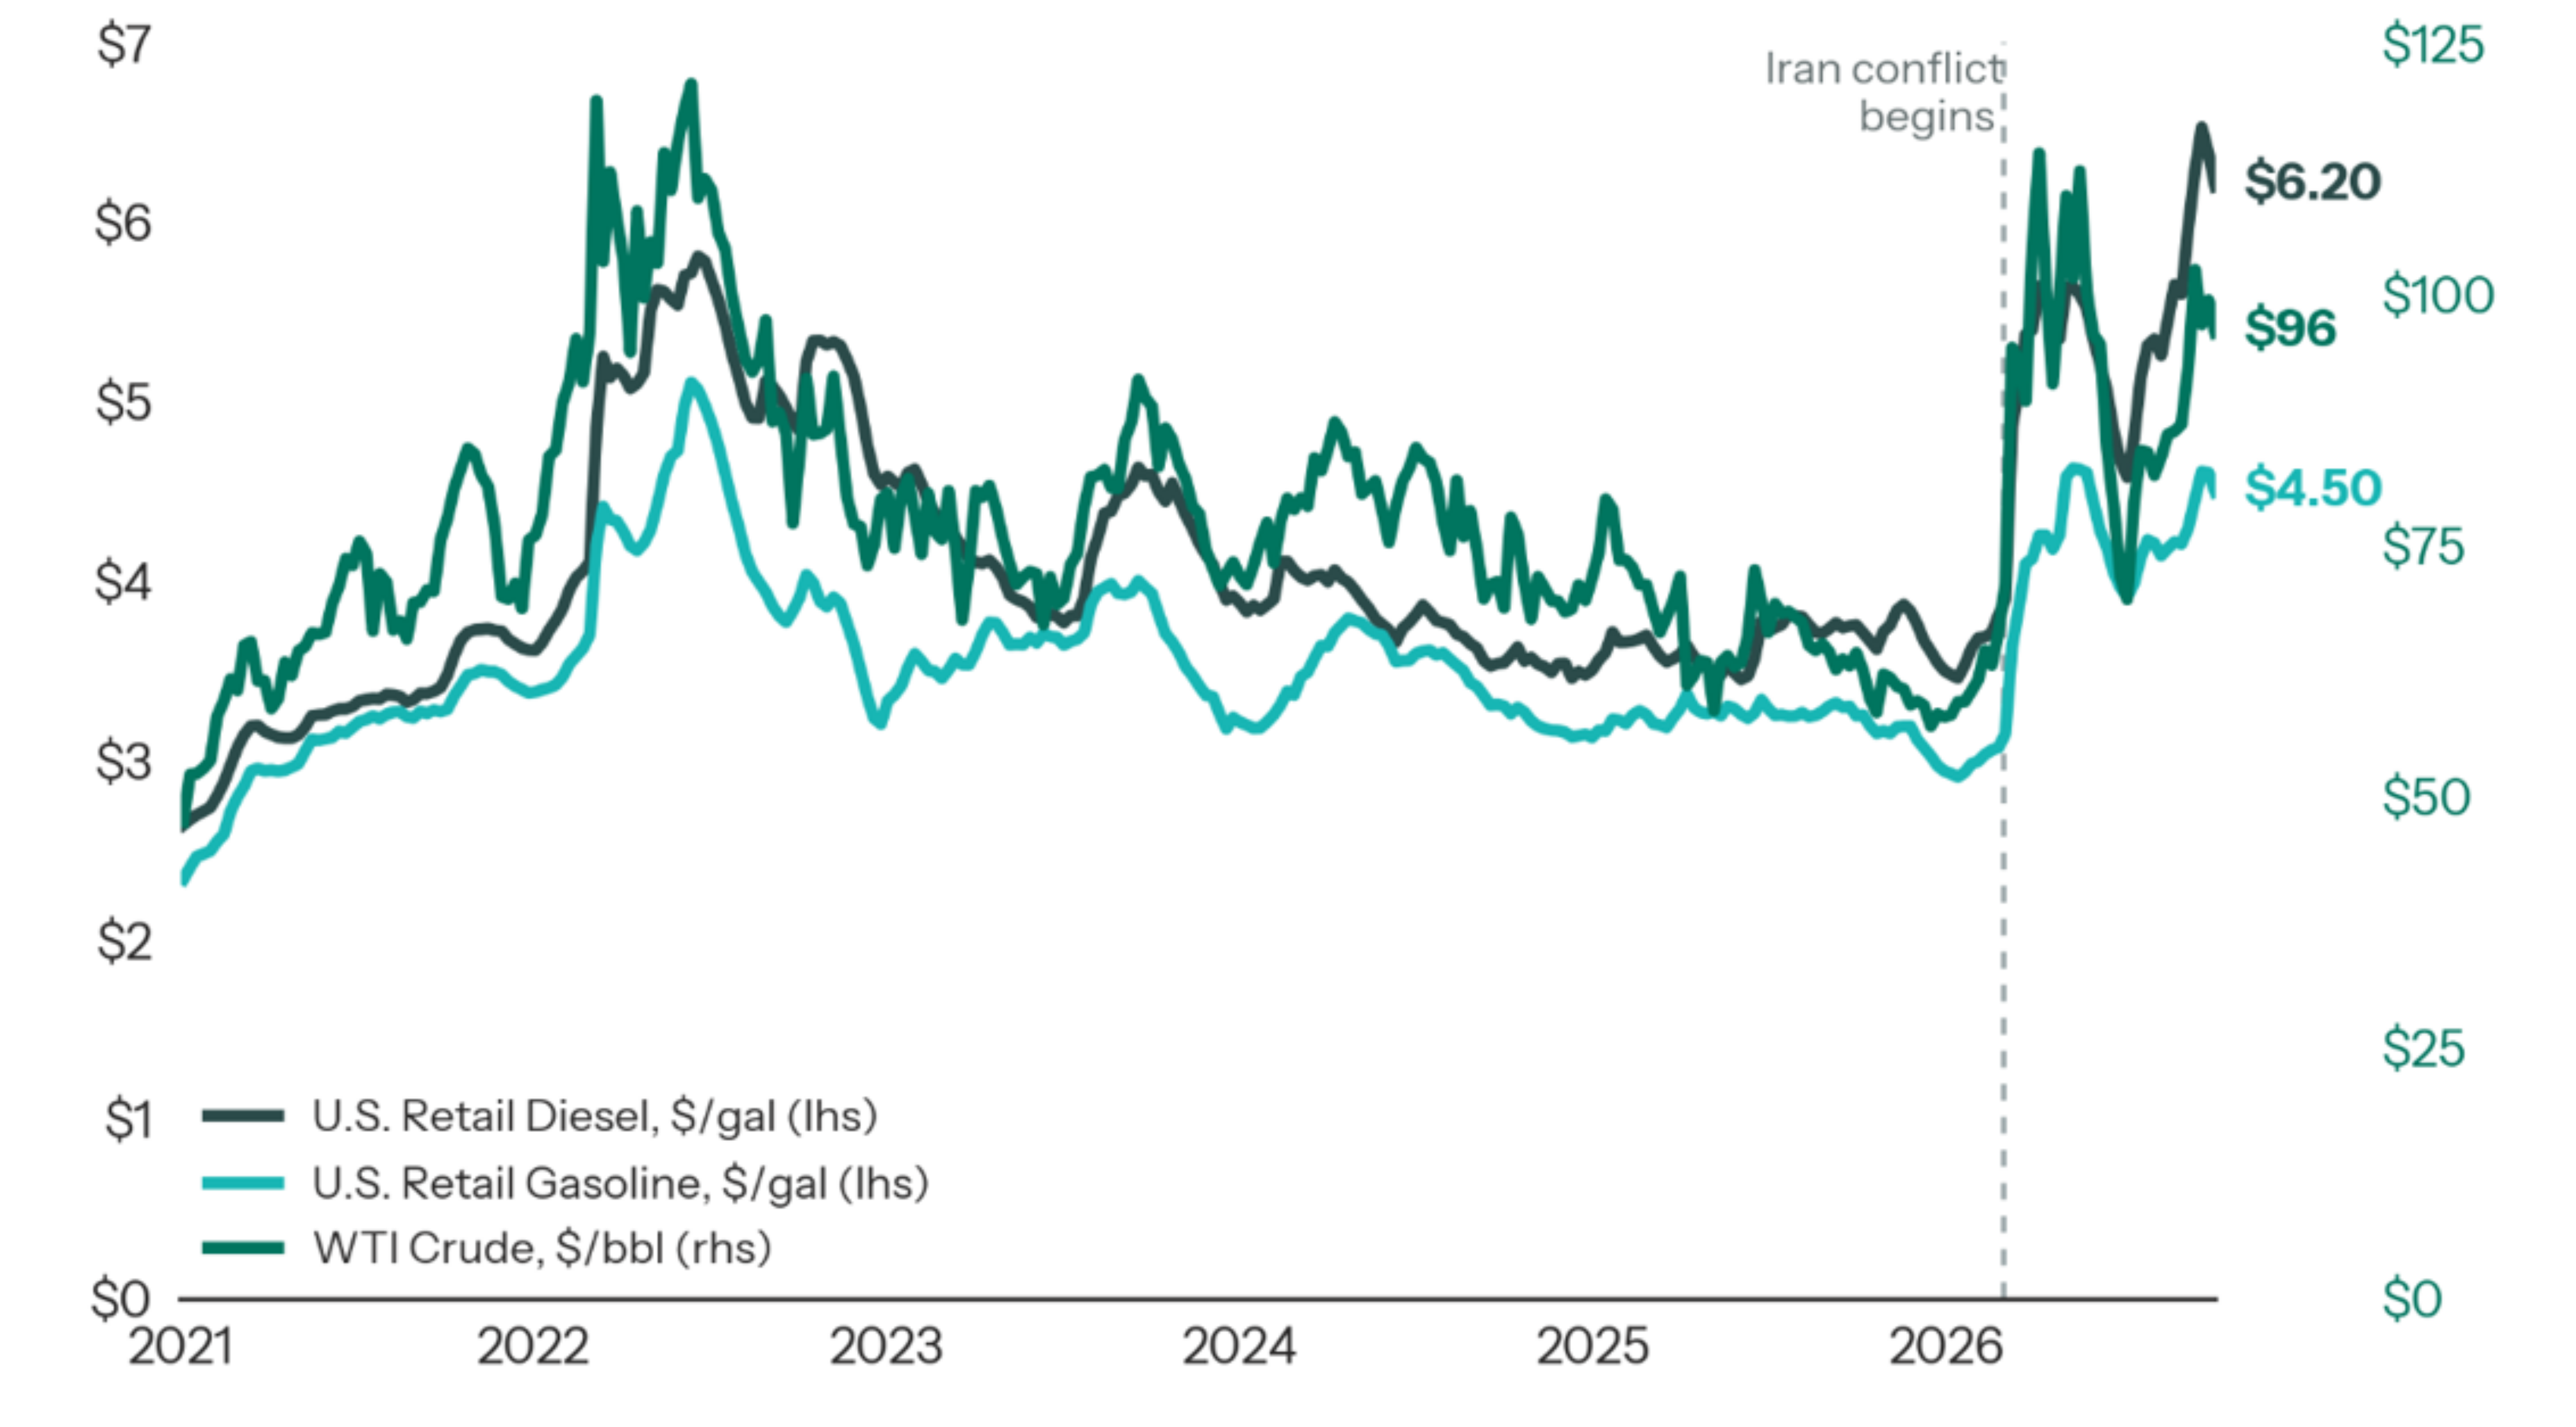
Despite periods of de-escalation early in the summer, the conflict in the Middle East remains ongoing, with renewed attacks on shipping and energy infrastructure pushing WTI crude back towards $100 a barrel. However, the more acute pressure has been in refined products rather than crude itself. While it appears that crude oil has been sourced from a range of producers, keeping a relative lid on prices, refining capacity is far more difficult to replace. Damage to refineries in the Middle East and Russia has reduced global refining output and contributed to record high refining margins[2], highlighted by all-time high prices in diesel.
Crude Oil, Diesel & Gasoline Prices
Source: YCharts, Energy Information Administration. As of 10/5/2026.
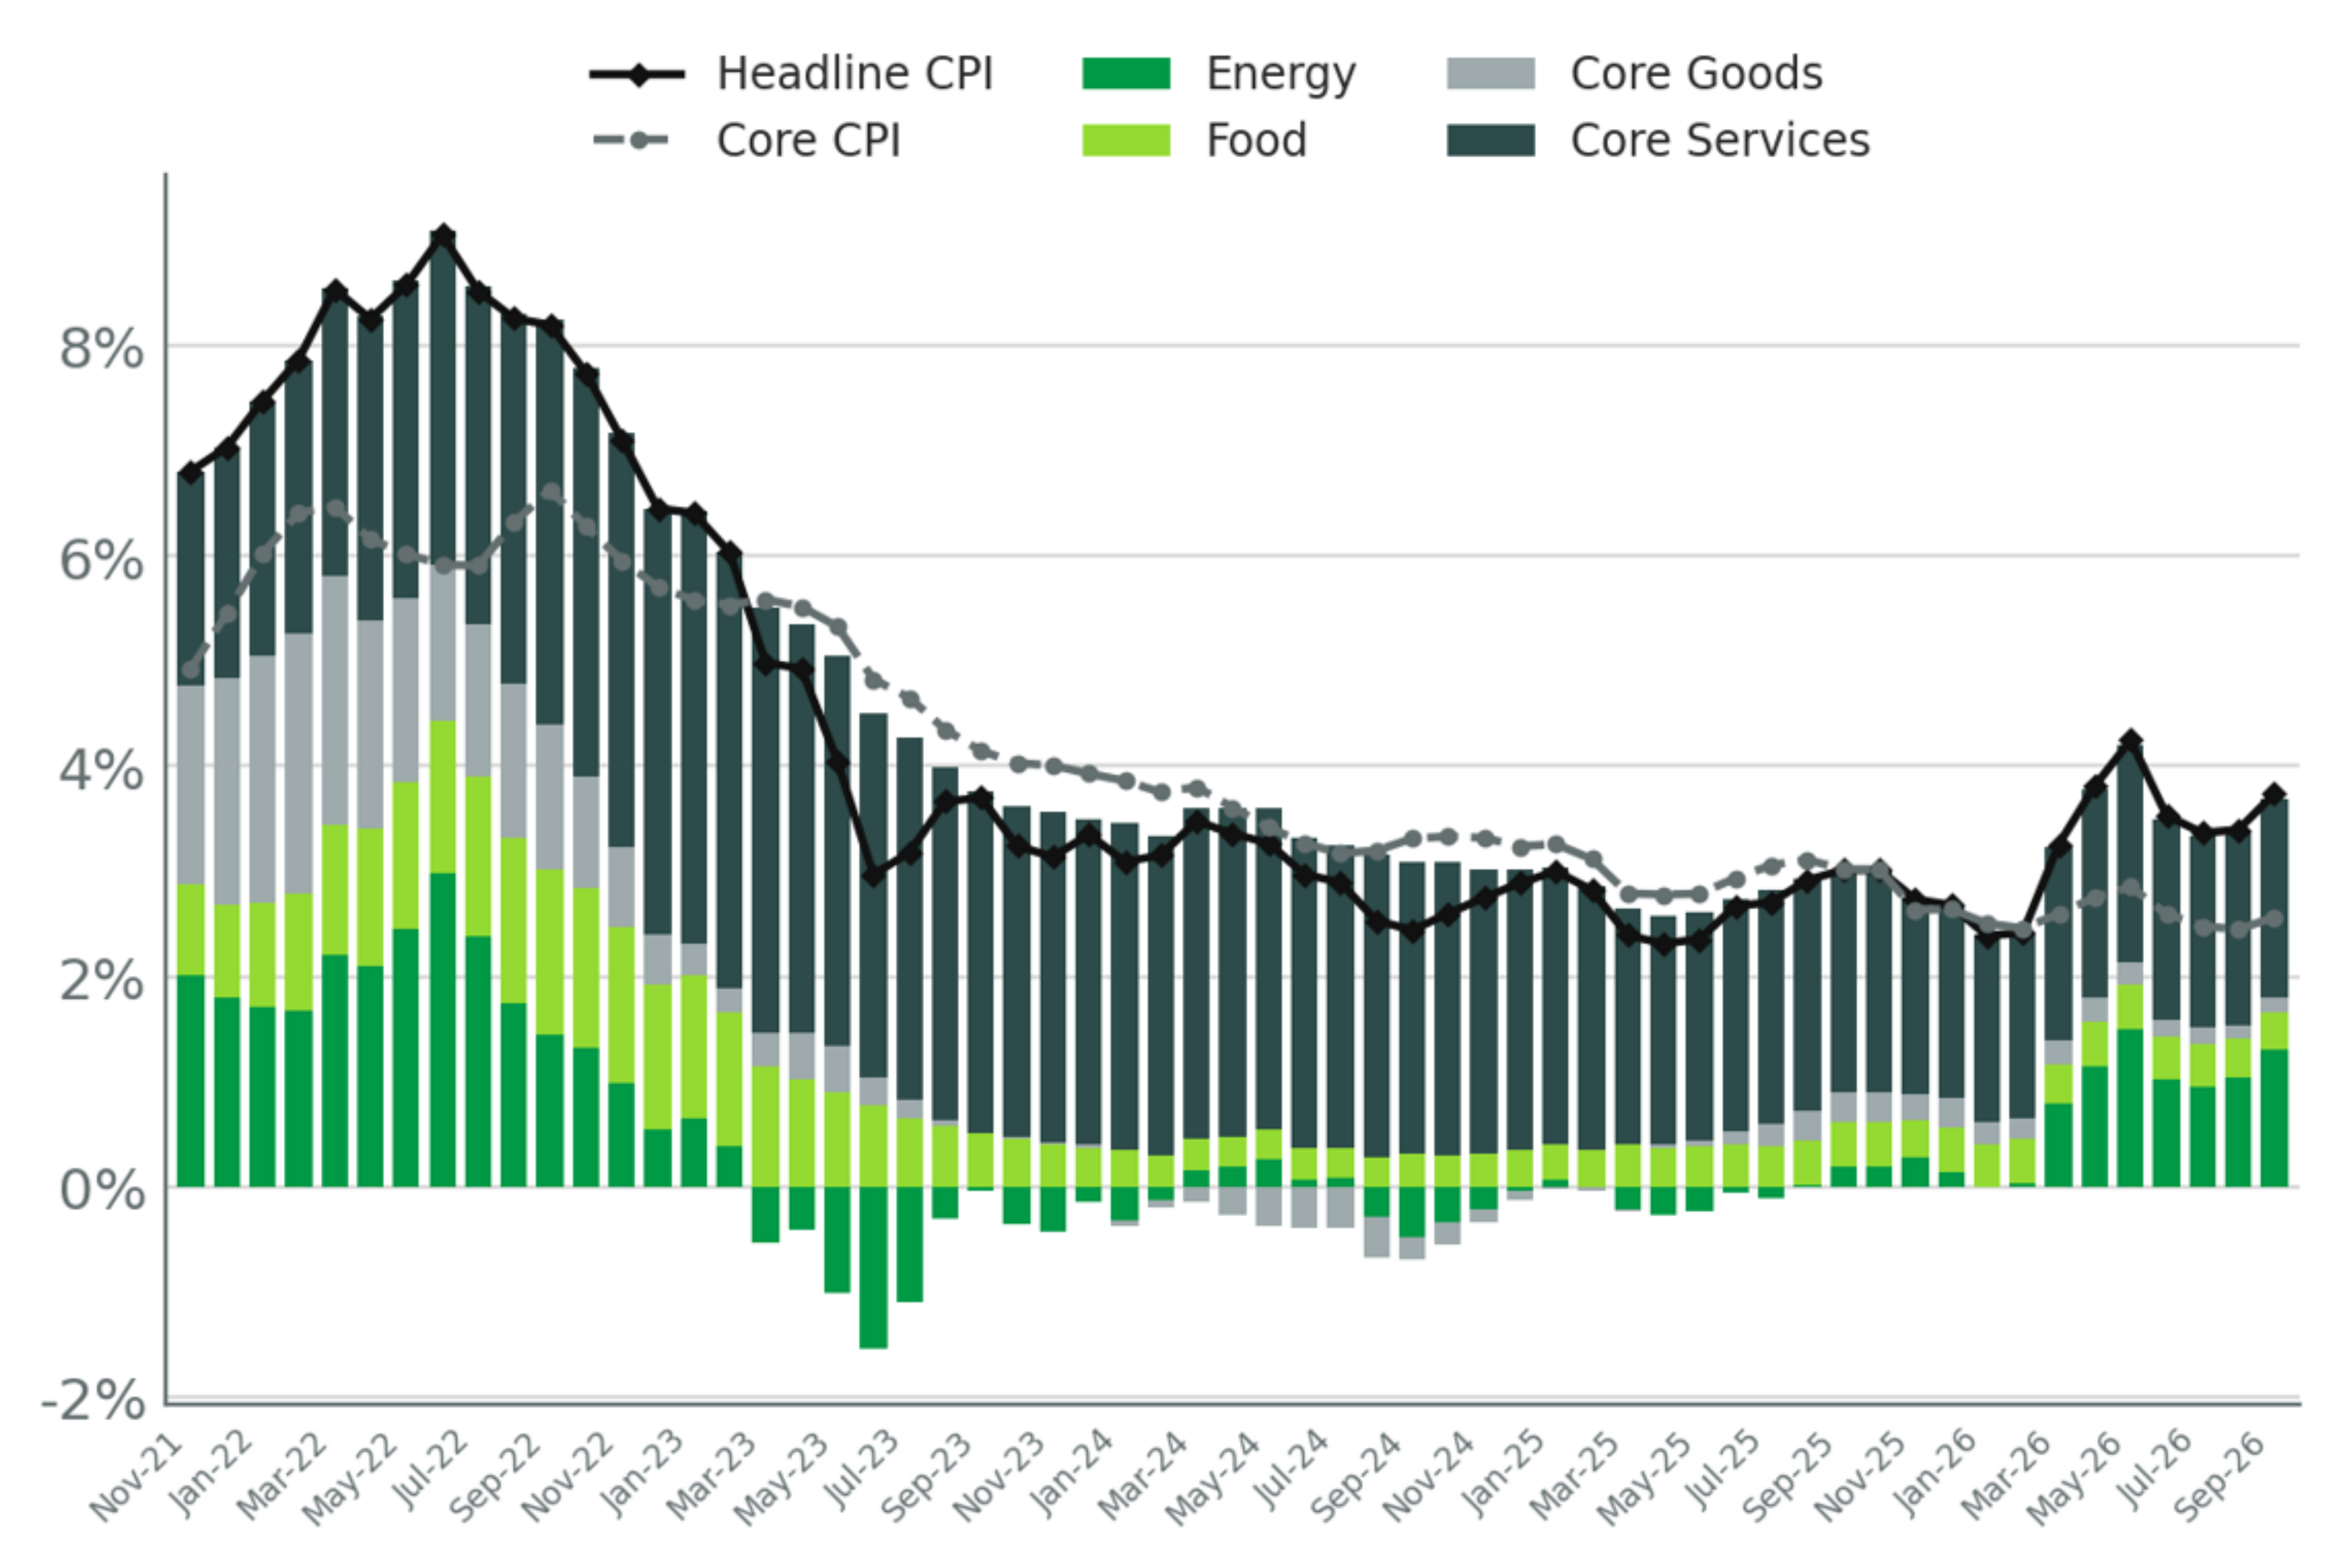
These higher energy costs have continued to flow through to consumer prices with headline CPI rising to 3.7% year-over-year in September, up from 2.4% in February. As shown below, energy has been the primary driver of this elevated CPI. Energy prices broadly are up 20% year-over-year, with Gasoline up 34% and Fuel Oil up nearly 75%. The energy component of CPI has contributed roughly 1/3rd of the total annual change in inflation, despite only comprising around a 6% weight in the CPI. Core CPI (which removes the more volatile components of Food & Energy) remains much closer to the Fed’s target, up 2.6% year-over-year through September[3]. While elevated energy prices are clearly a burden on consumers and businesses, they reflect a geopolitically driven supply shock that monetary policy has limited ability to address directly.
Contributors to CPI
Source: Bloomberg, Bureau of Labor Statistics. As of September 2026.
Outside of Energy, Shelter via the Core Services remains the largest contributor to core inflation. Shelter costs rose 3.2% over the past year and are the largest individual component of Core CPI, representing roughly 1/3rd of the measure. While we are not expecting a decline in housing costs, shelter is a heavily lagged measure in our view and has continued to gradually moderate from the elevated levels seen in 2022/2023[4].
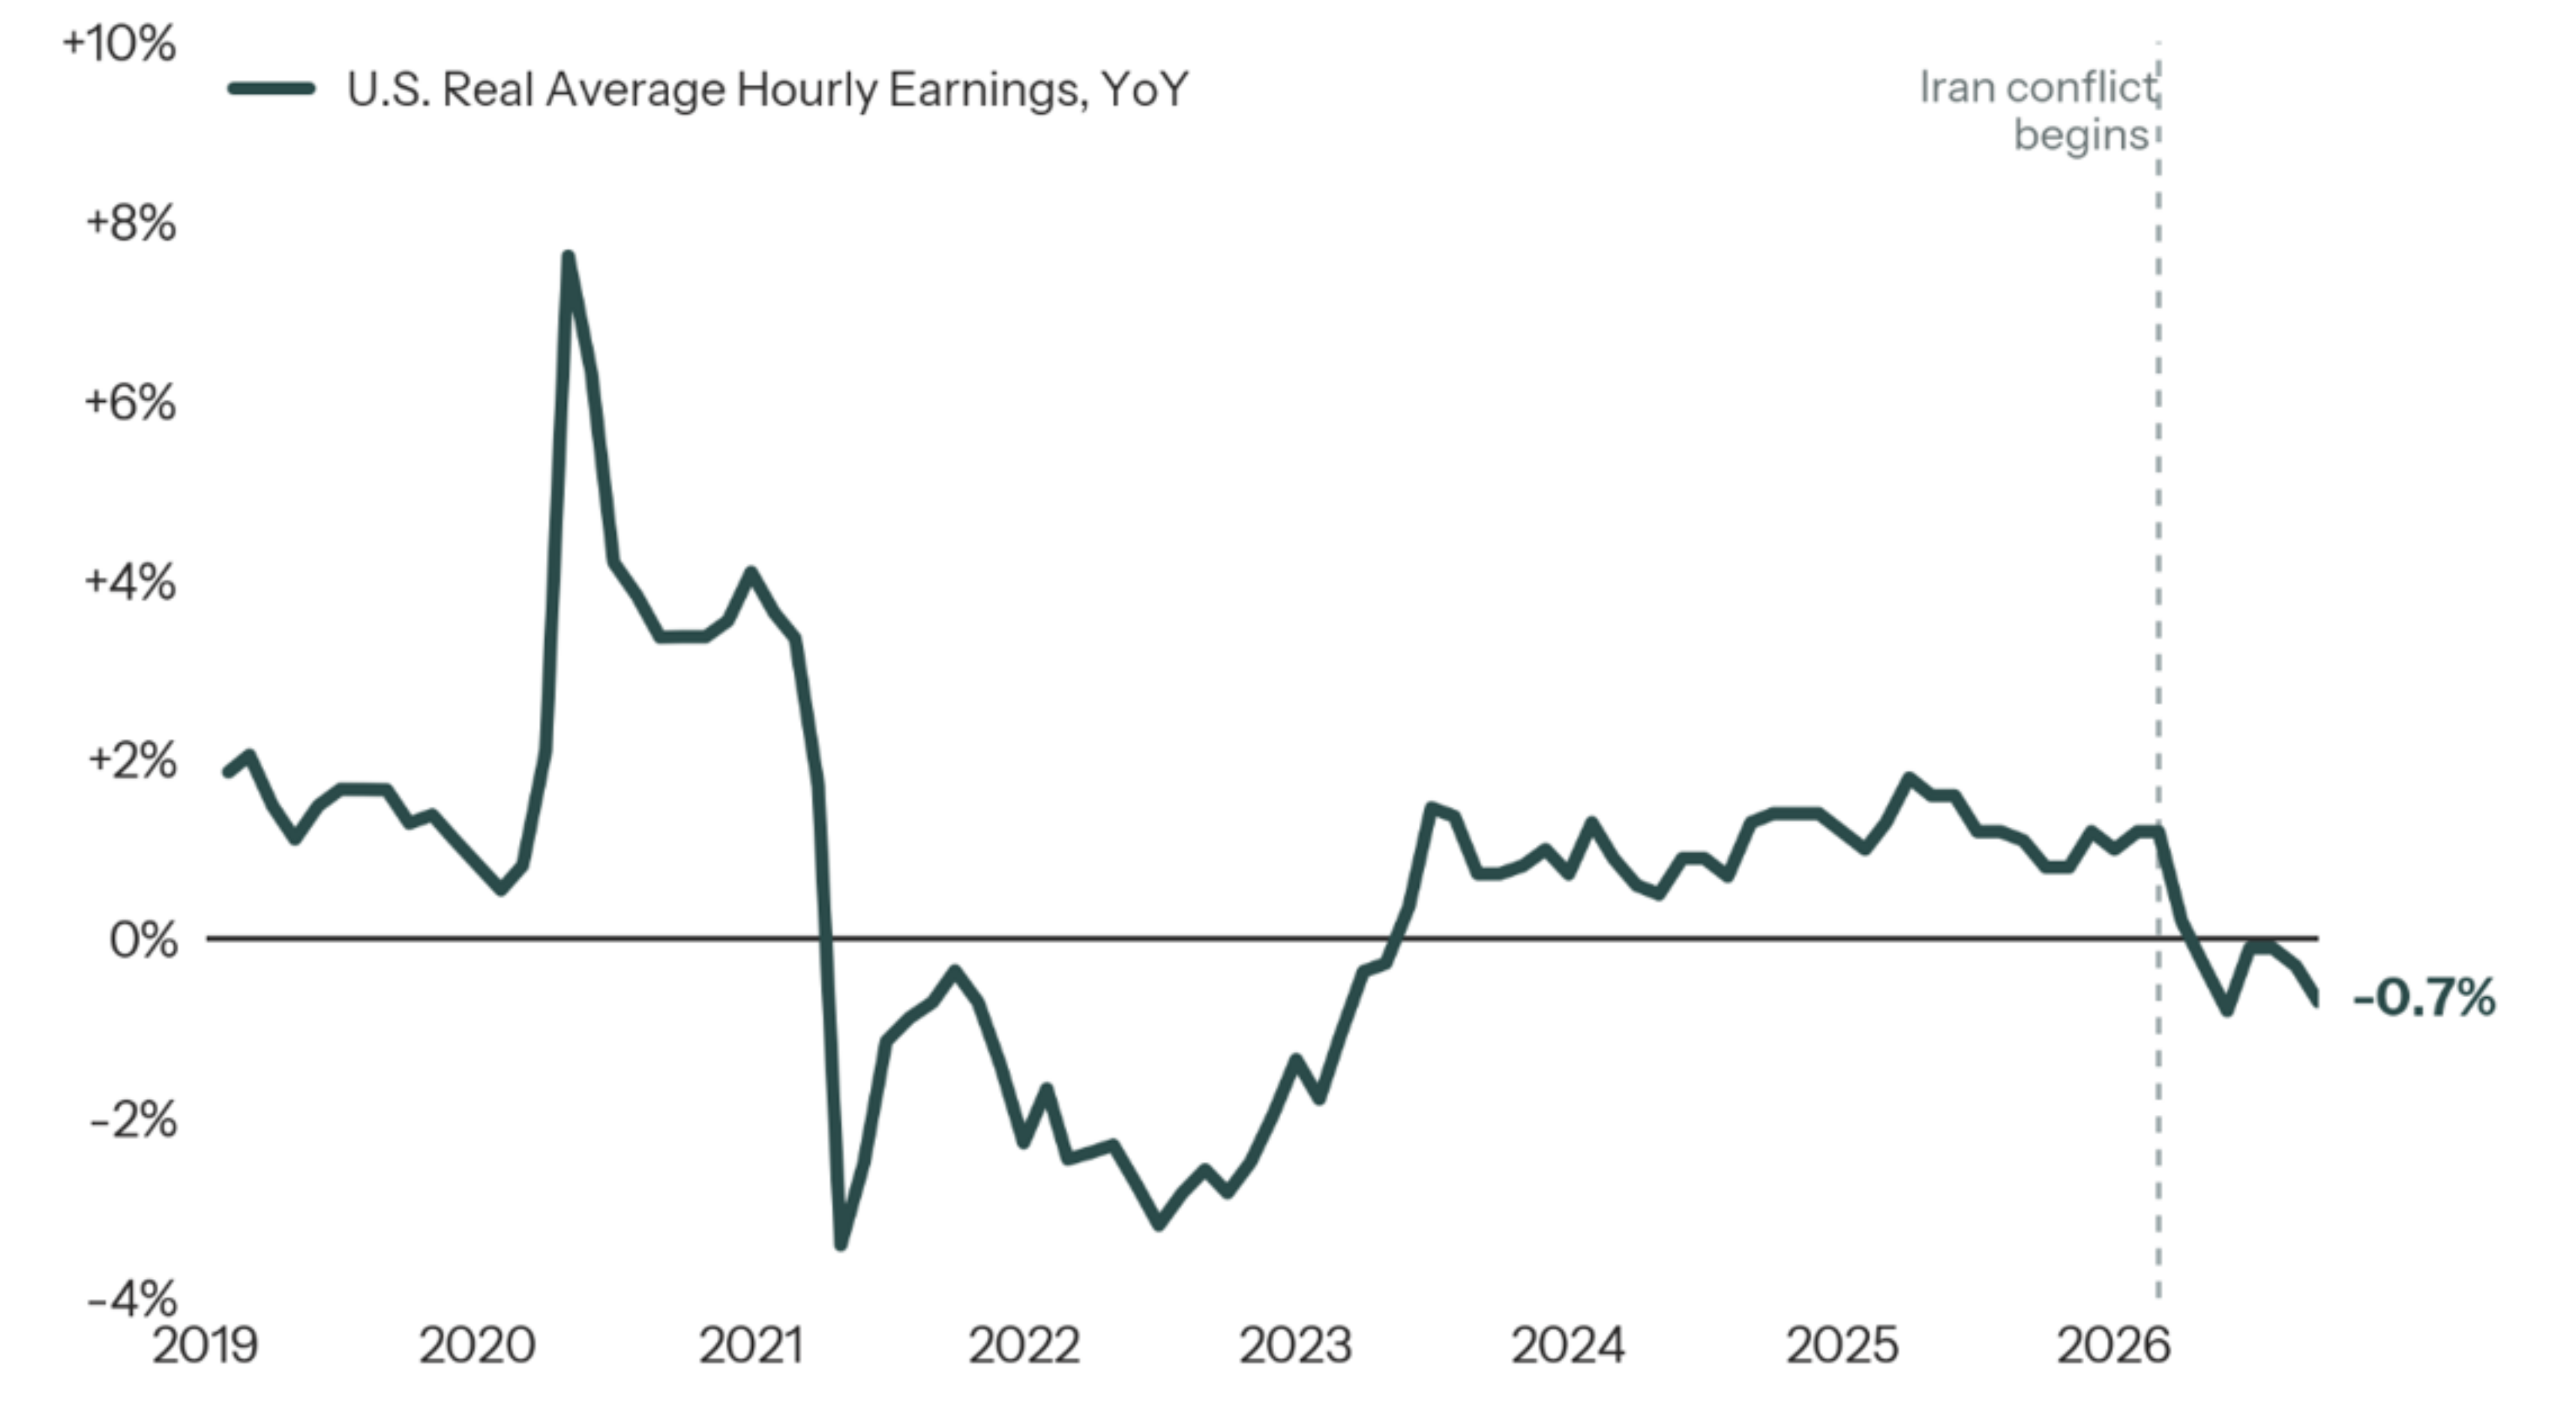
In addition, wage growth has also remained subdued. Real average hourly earnings (wage growth adjusted for inflation) were -0.7% through September, the lowest level since 2023 and well below the peaks seen in 2021. This is an important distinction from the post-COVID inflation spike when a tight labor market and rapid wage gains helped contribute to embedded inflation.
US Real Average Hourly Earnings Year-Over-Year
Source: YCharts, Bureau of Labor Statistics. As of September 2026.
Taken together, the data suggests that while inflationary pressure is clearly evident, it is far less broad-based than the inflationary pressures experienced post-COVID. While the Fed is likely to continue to respond to elevated inflation with continued hikes, the relatively narrow drivers of these price pressures should help keep interest rate hikes limited in scope. However, the broadening out of inflationary pressure or signs of unanchored longer-term inflation expectations may force the Fed to hike more aggressively and warrants close monitoring.
Economic Growth Remains Resilient, Despite Pockets of Rate-Impacted Sectors
Despite the energy shock and move higher in rates, the U.S. economy has continued to expand at a healthy pace. Real GDP grew at an annualized rate of 2.5% in Q1 and 2.2% in Q2, with expectations for over 3% growth in Q3. This represents an extremely healthy level of growth in the economy, despite the elevated inflationary pressures.
Quarterly U.S. GDP Growth Annualized
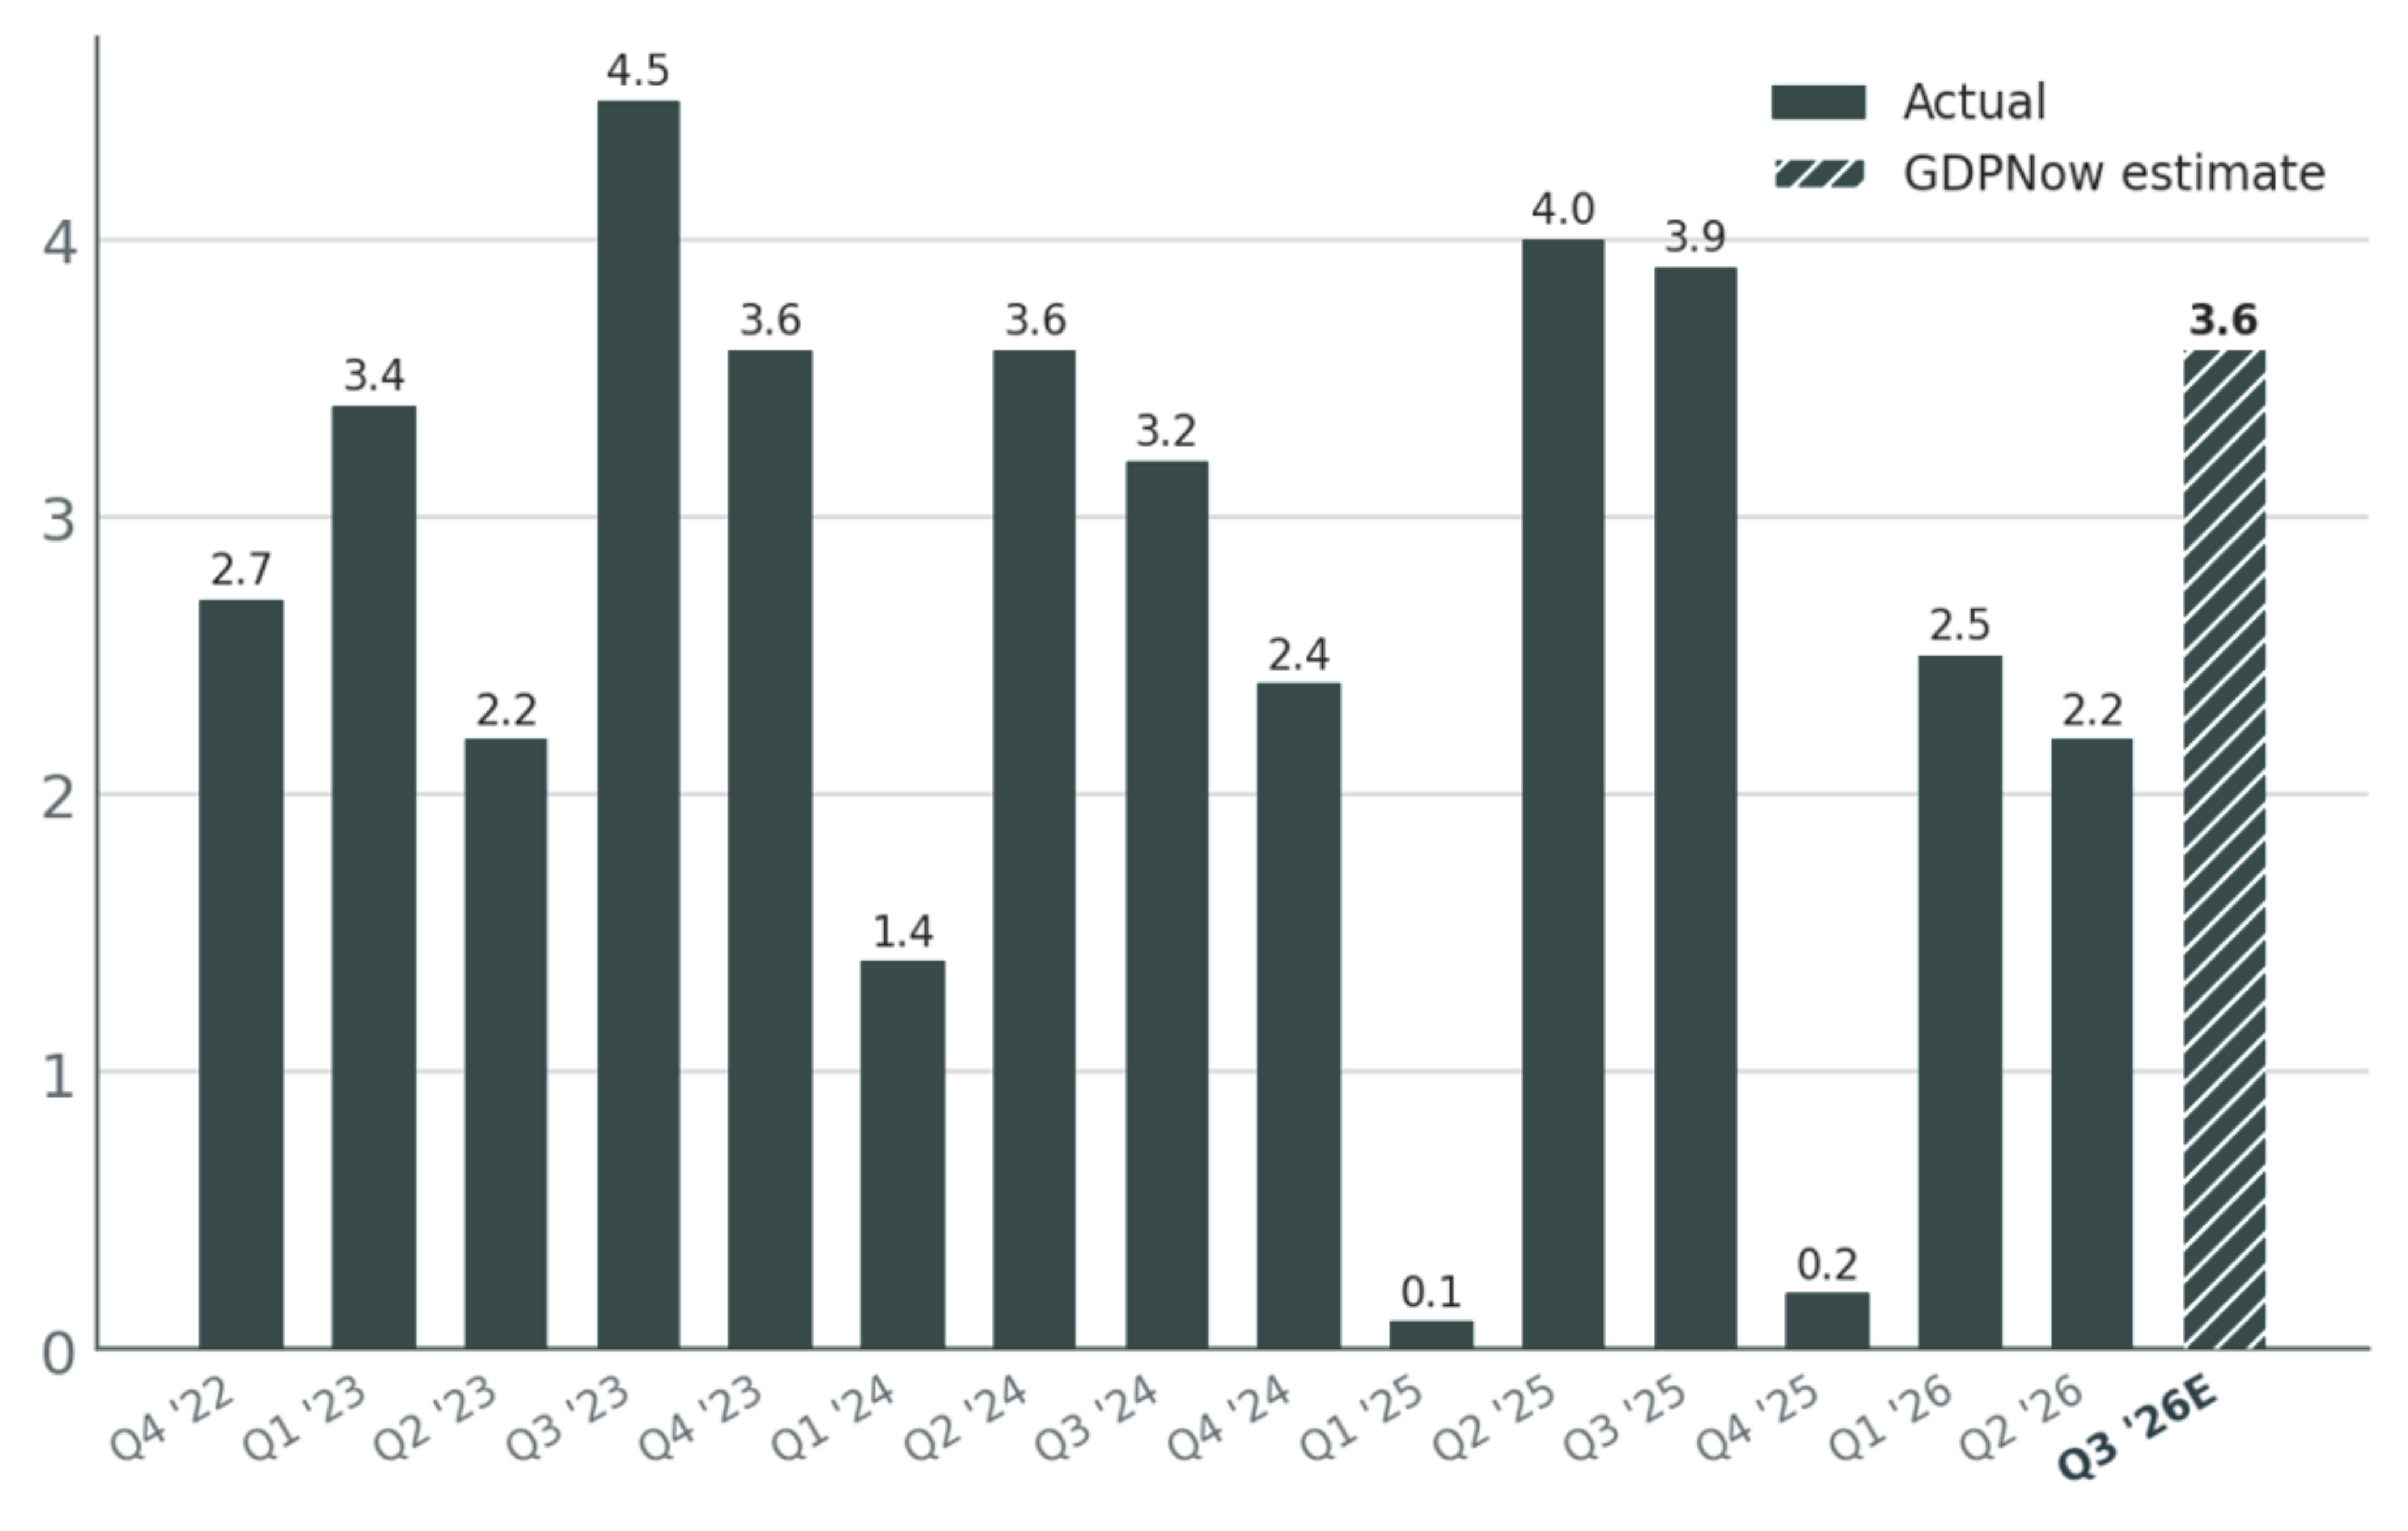
Source: YCharts, U.S. Bureau of Economic Analysis. Through Q2 2026. GDPNow estimate as of 10/8/2026.
The consumer has been a key driver of the economic strength in the US. Retail sales rose over 6% year-over-year through September, and while higher gasoline prices have inflated the headline figure, the measure excluding gas stations was still +4.5% year-over-year[5]. Retail sales adjusted for inflation were up 2.5% over the same period, above the long-term average despite the negative real wage growth[6]. However, this may pose a risk if inflation remains elevated for an extended period of time, further eroding real earnings.
U.S. Retail Sales Growth Year-Over-Year
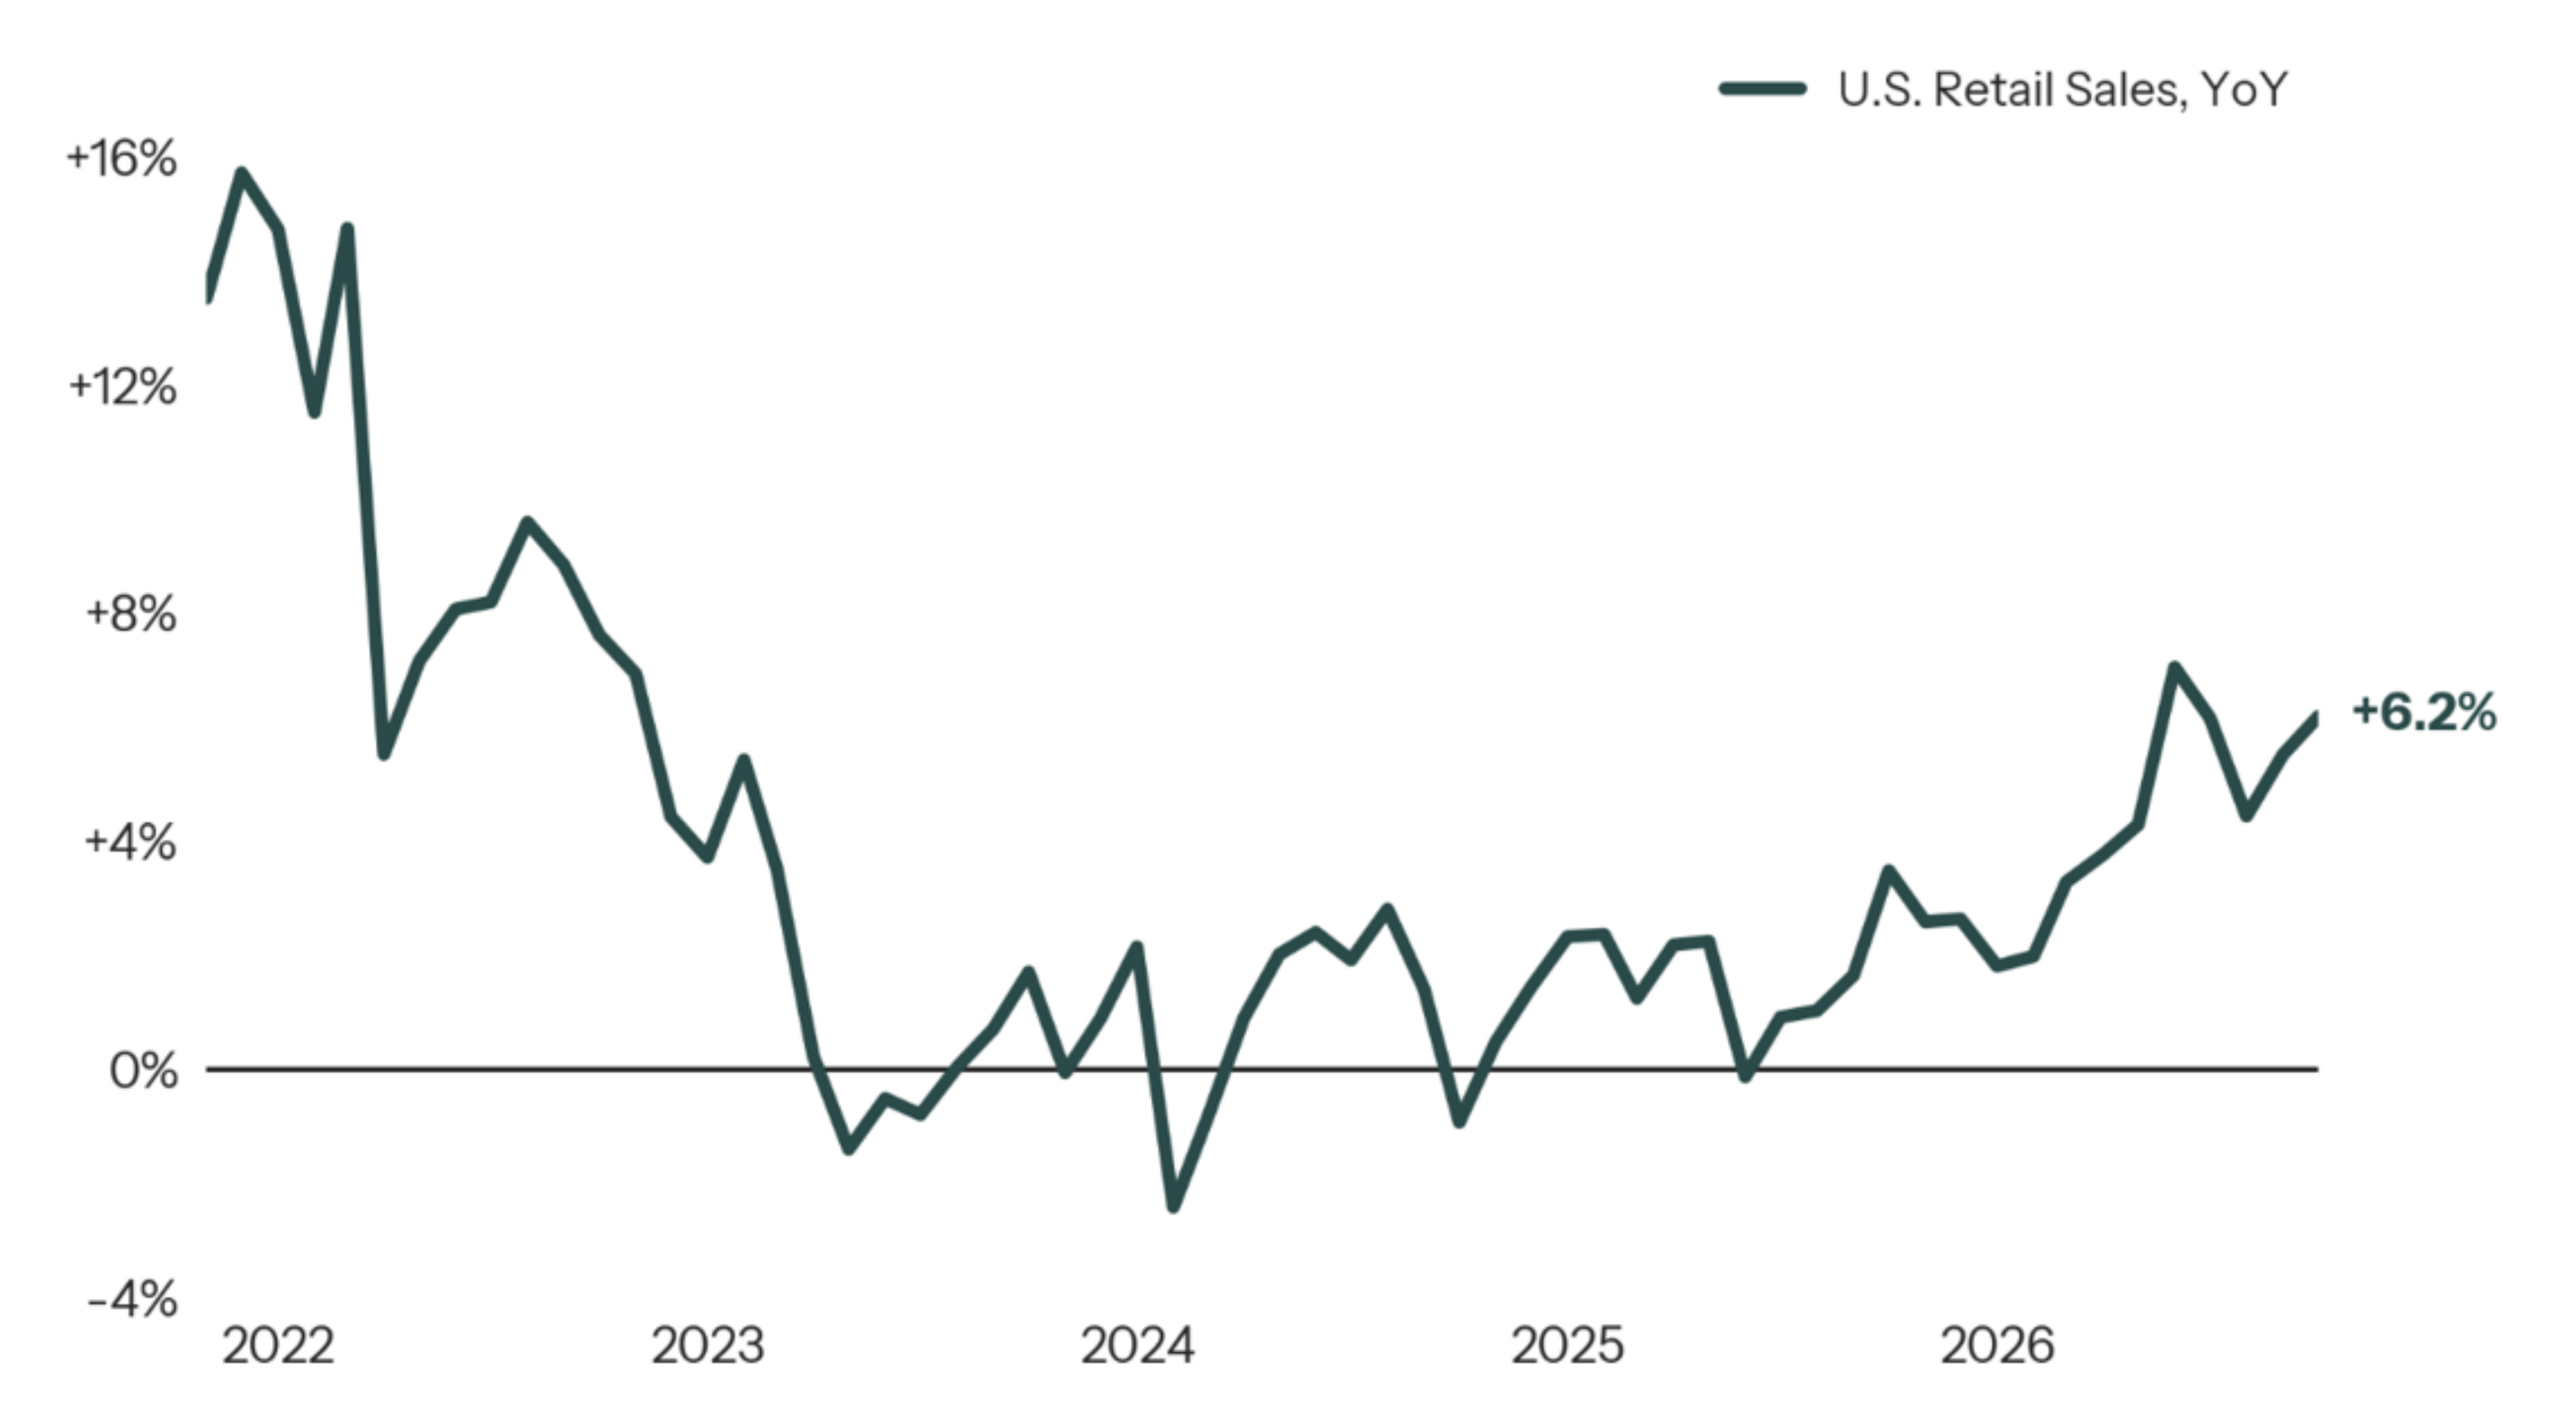
Source: U.S. Census Bureau, YCharts. As of September 2026.
Investment in AI infrastructure has provided another significant tailwind – a consistent theme from recent quarters. The four largest hyperscalers (Amazon, Microsoft, Alphabet and Meta) spent a combined $376 billion on capital expenditures in 2025, a figure expected to grow to over $730 billion in 2026. This figure does not include expenditures from Oracle, the other largest spender on AI infrastructure. Including Oracle, Goldman expects 2027 CAPEX of hyperscalers to grow from roughly $800 billion this year to potentially $1.2 trillion in 2027[7]. In our view, the degree of AI infrastructure spending has been a major driver of the economic resilience experienced in recent years, a tailwind that is expected to persist in upcoming years. Notably, the official GDP figures understate the full scale of the buildout as many of the electrical components and chips are imported (which are stripped out from the GDP calculation).
Hyperscaler Annual CAPEX ($mms)

Source: Company 10-K/earnings filings with the SEC. 2026 figures are company guidance as of Q2 2026 earnings.
While the pace of hiring has slowed considerably, the labor market has not shown signs of broad-based layoffs. Despite nonfarm payrolls growing by just 29,000 in September, the unemployment rate has held in a narrow range near 4% over the year, while initial and continuing jobless claims have moved lower over the last year. In our view, this low-hire, low-fire environment continues to support household income and spending, even as job growth has cooled and inflation has picked up.
U.S. Initial and Continuing Jobless Claims
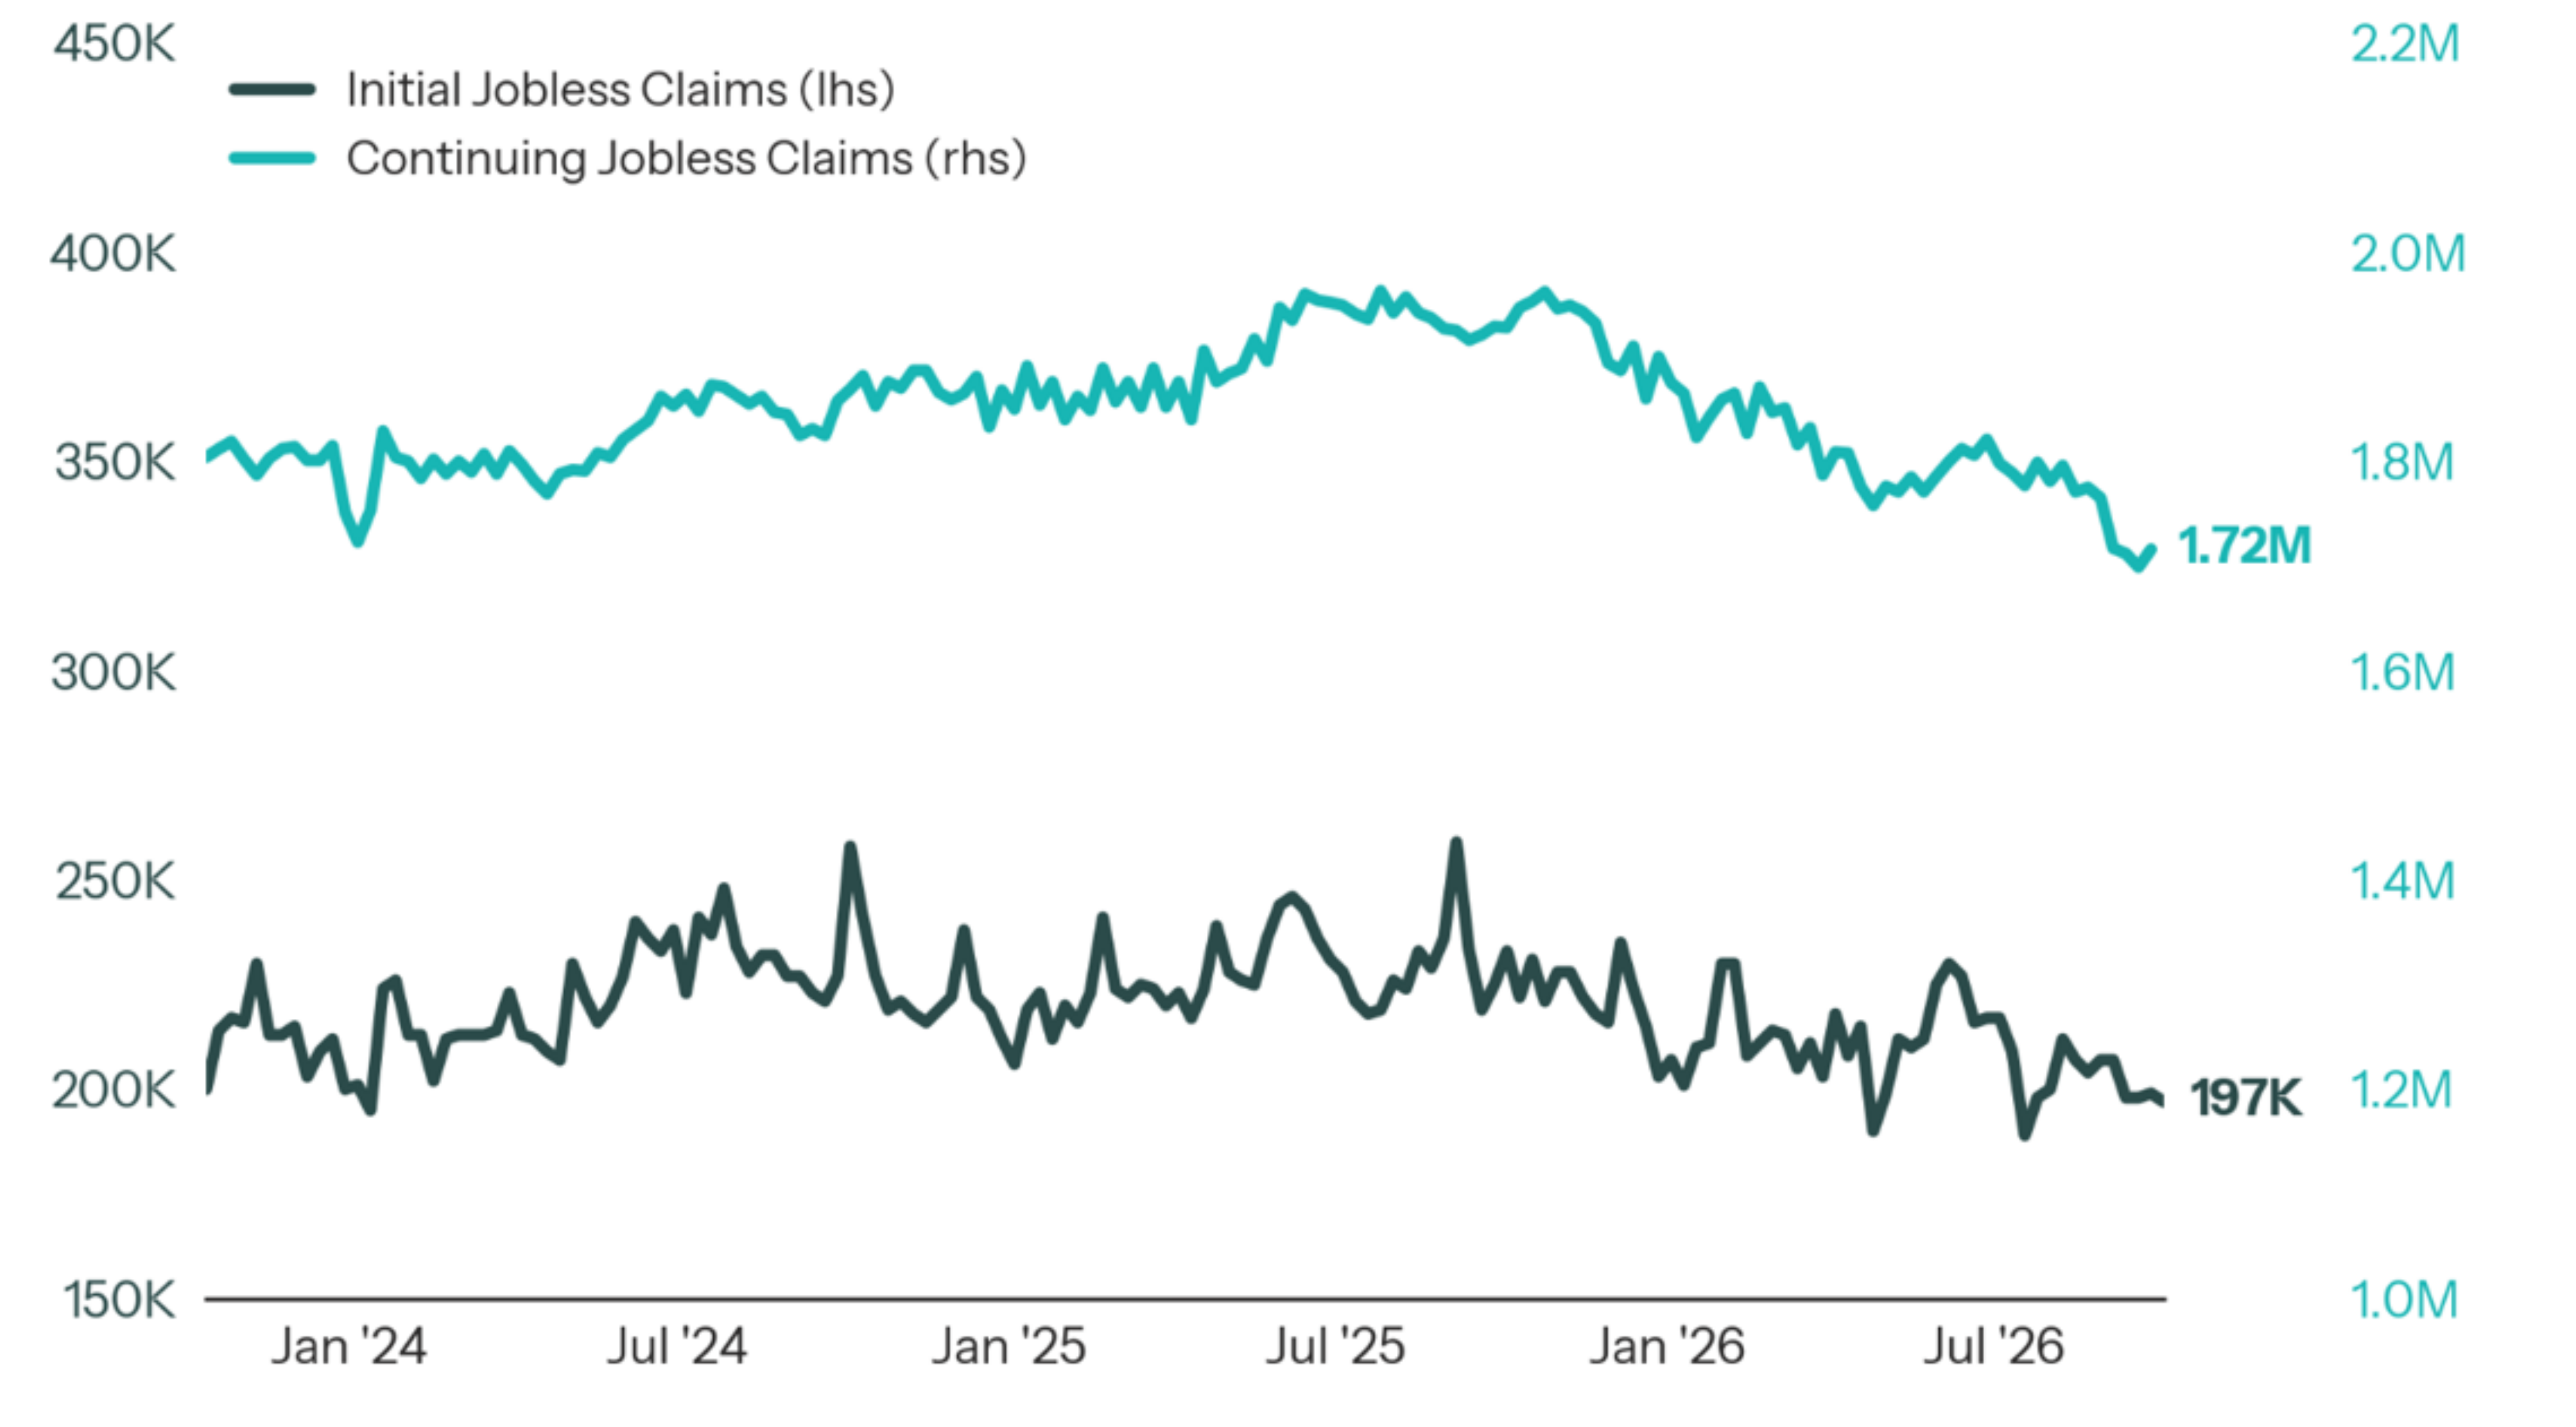
Source: YCharts, Bureau of Labor Statistics. As of September 2026.
However, the housing market offers a clear example of how higher rates can weigh on activity over time. After peaking in late 2023, mortgage rates had gradually declined to roughly 6% before the war in Iran but has since climbed back to cycle highs above 7%. Existing home sales and other measures of housing activity have remained depressed throughout this period. With mortgage rates moving higher again, this pressure on housing activity appears likely to persist. While the economy has weathered through this period of soft housing markets, it has been largely due to the consumer strength and AI infrastructure spending noted above. Cracks to either of these sectors could result in more pressure on the economy at large given the backdrop of high rates.
U.S. Existing Home Sales and 30-Year Mortgage Rates
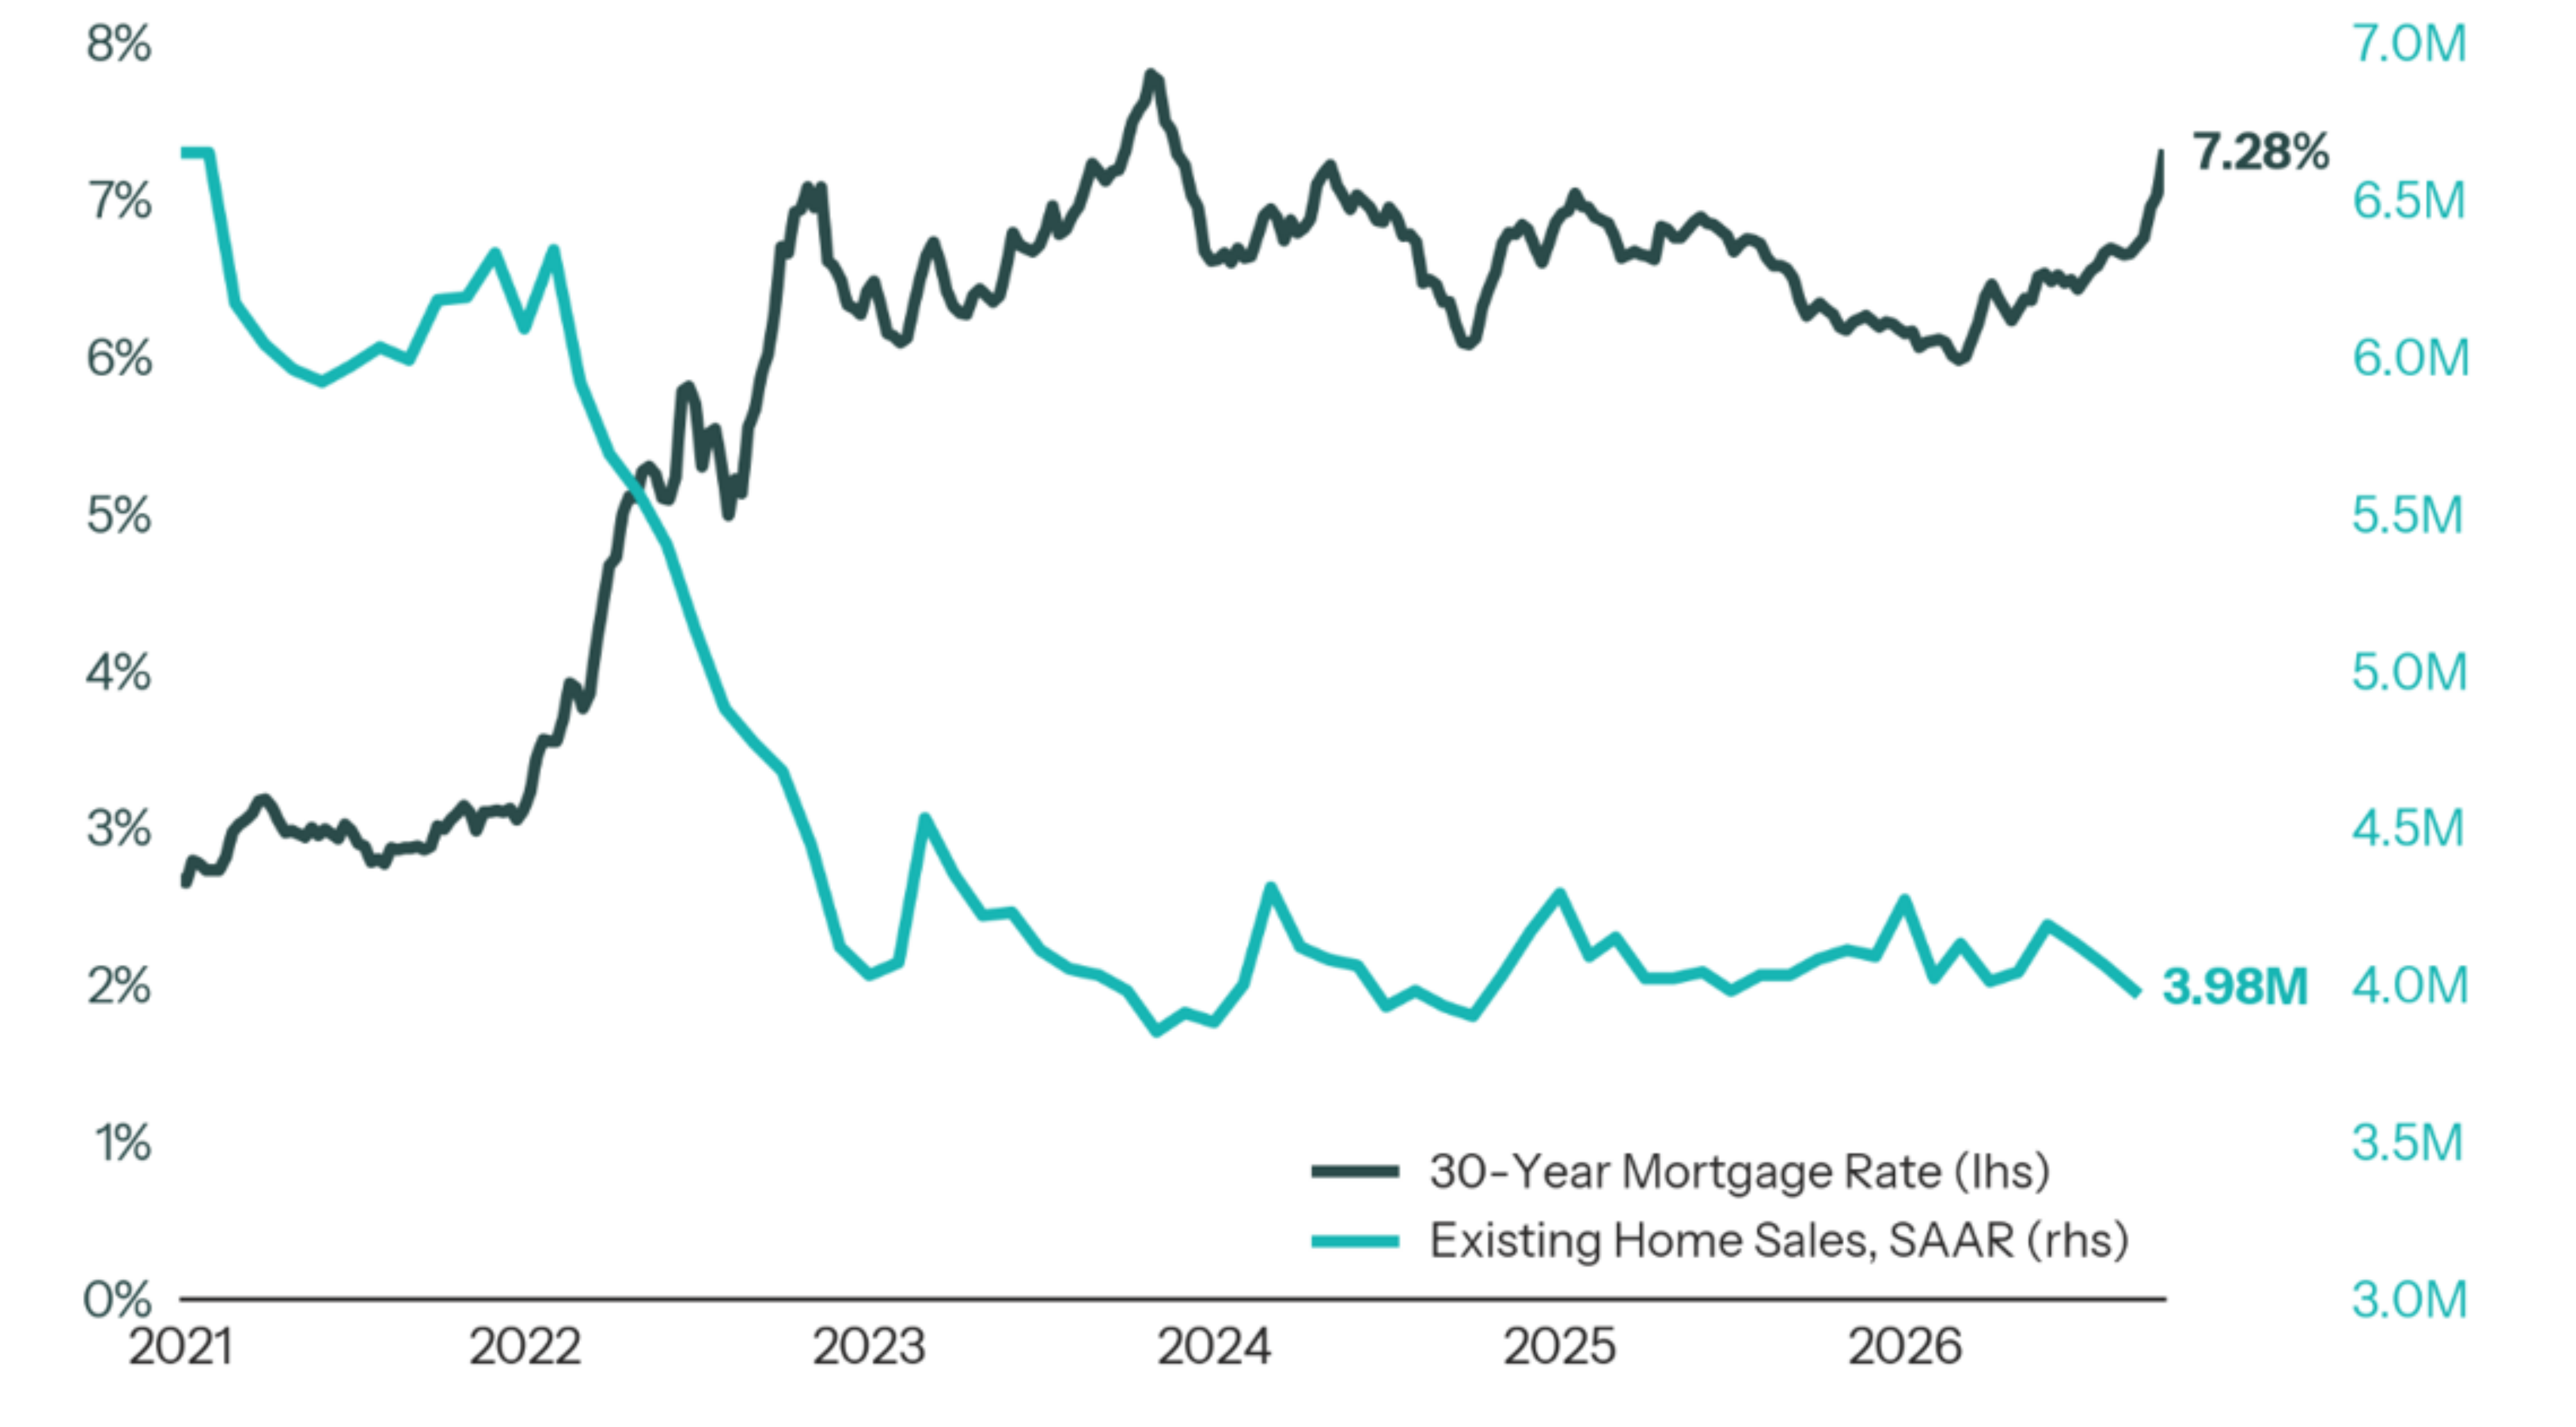
Source: YCharts, as of 9/30/2026.
Equity Indices Continue to Reach All-Time-Highs, but Dispersion Remains Beneath the Surface
Despite the move higher in rates, the S&P 500 rose 2.0% in Q3, bringing year-to-date performance to +12.7%. While many have noted the stability of the S&P despite the move in rates, this headline performance somewhat masks the degree of pressure experienced over the past 3 months. The S&P 500 Equal Weight, which gives an equivalent weight to each company regardless of market cap, fell 2.3% in Q3 and nearly 5% in September alone. Since the breakout of conflict in Iran in early March, the S&P 500 is up nearly 12% while the Equal Weight index is up only 3%. From a sector perspective, the S&P 500’s performance has been concentrated in two sectors, Information Technology and Energy, while the more rate sensitive parts of the market, including utilities, real estate, financials and small caps, declined over the quarter.
S&P 500 Cap-Weight vs Equal Weight Performance
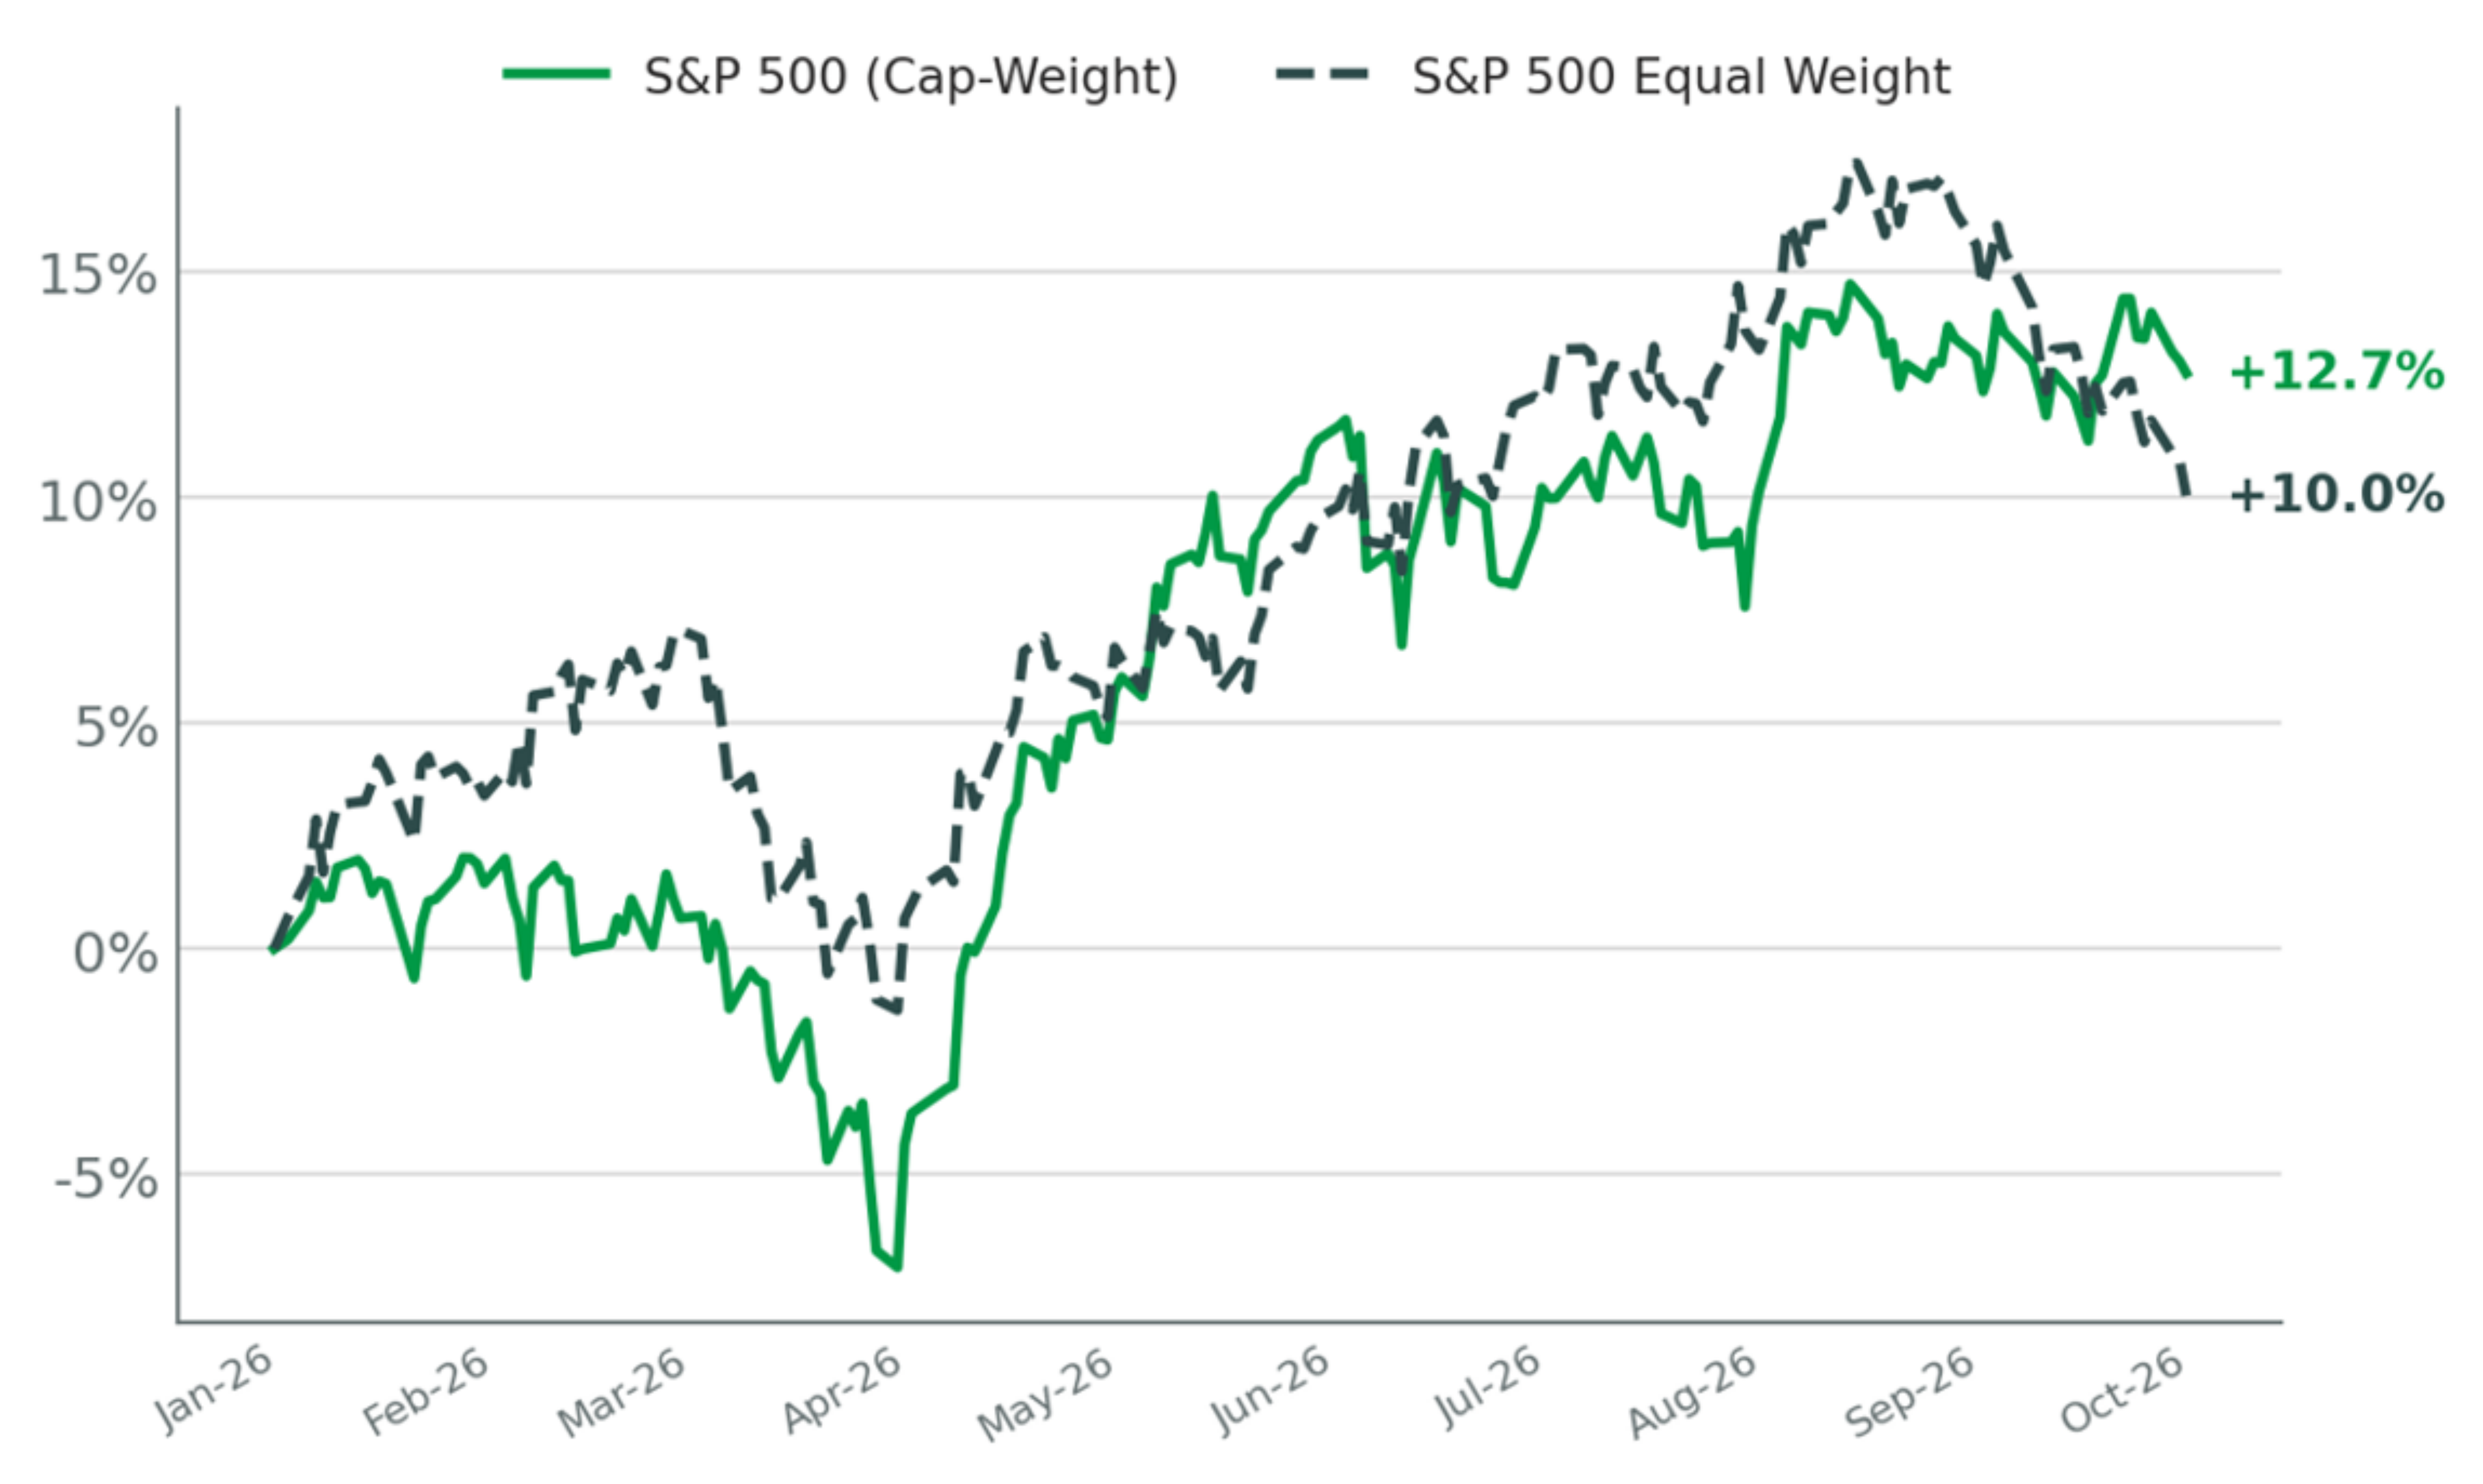
Source: YCharts. As of 9/30/2026
S&P 500 Sector Year-to-Date Return
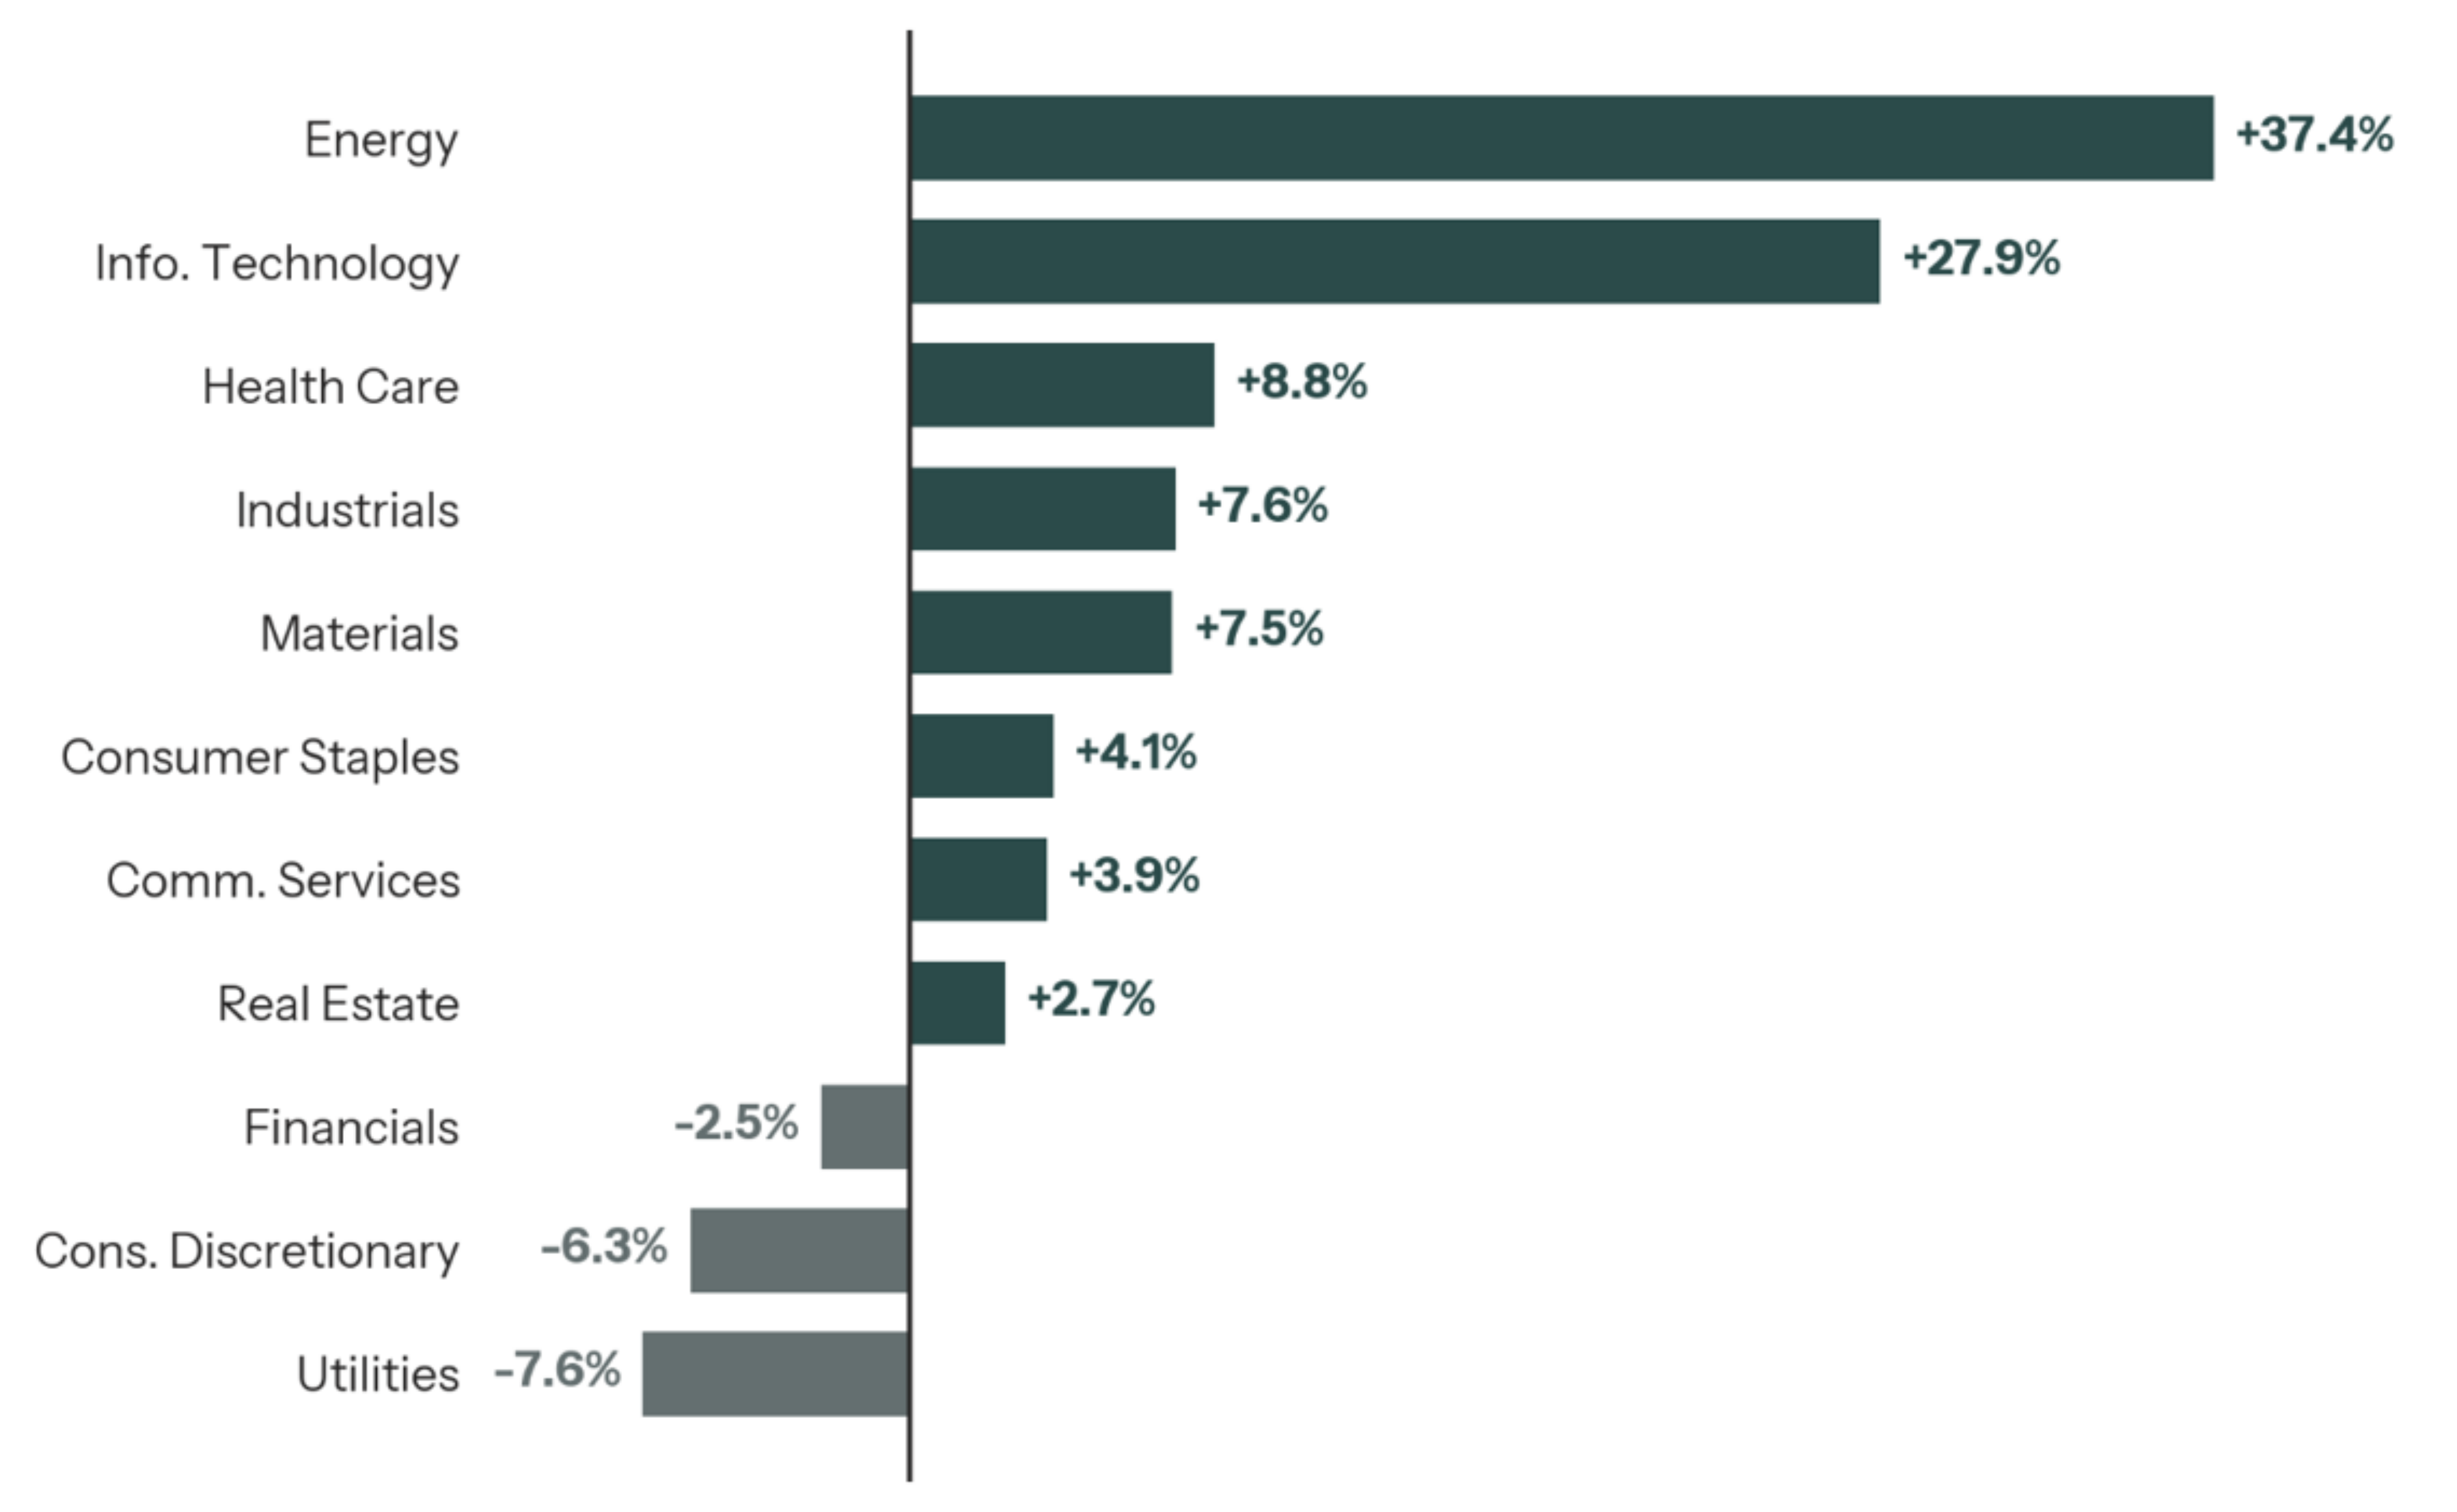
Source: YCharts. As of 9/30/2026.
Higher rates have also weighed on valuations, a dynamic we’ve experienced over the course of the year. The forward price-to-earnings ratio of the S&P 500 has declined from roughly 22x at the start of the year to under 19x by the end of Q3, slightly below the 10-year average. Over the same period, analysts’ forward earnings estimates rose roughly 30%, highlighting that the returns of equities this year have been driven by earnings growth as opposed to rising valuations. This does not mean that the PE ratio cannot come down further or that forward EPS estimates underperform expectations, but it highlights that higher rates have already been priced into equities to some degree, in our view.
S&P 500 Forward Price to Earnings and Forward 12 Month EPS Estimate
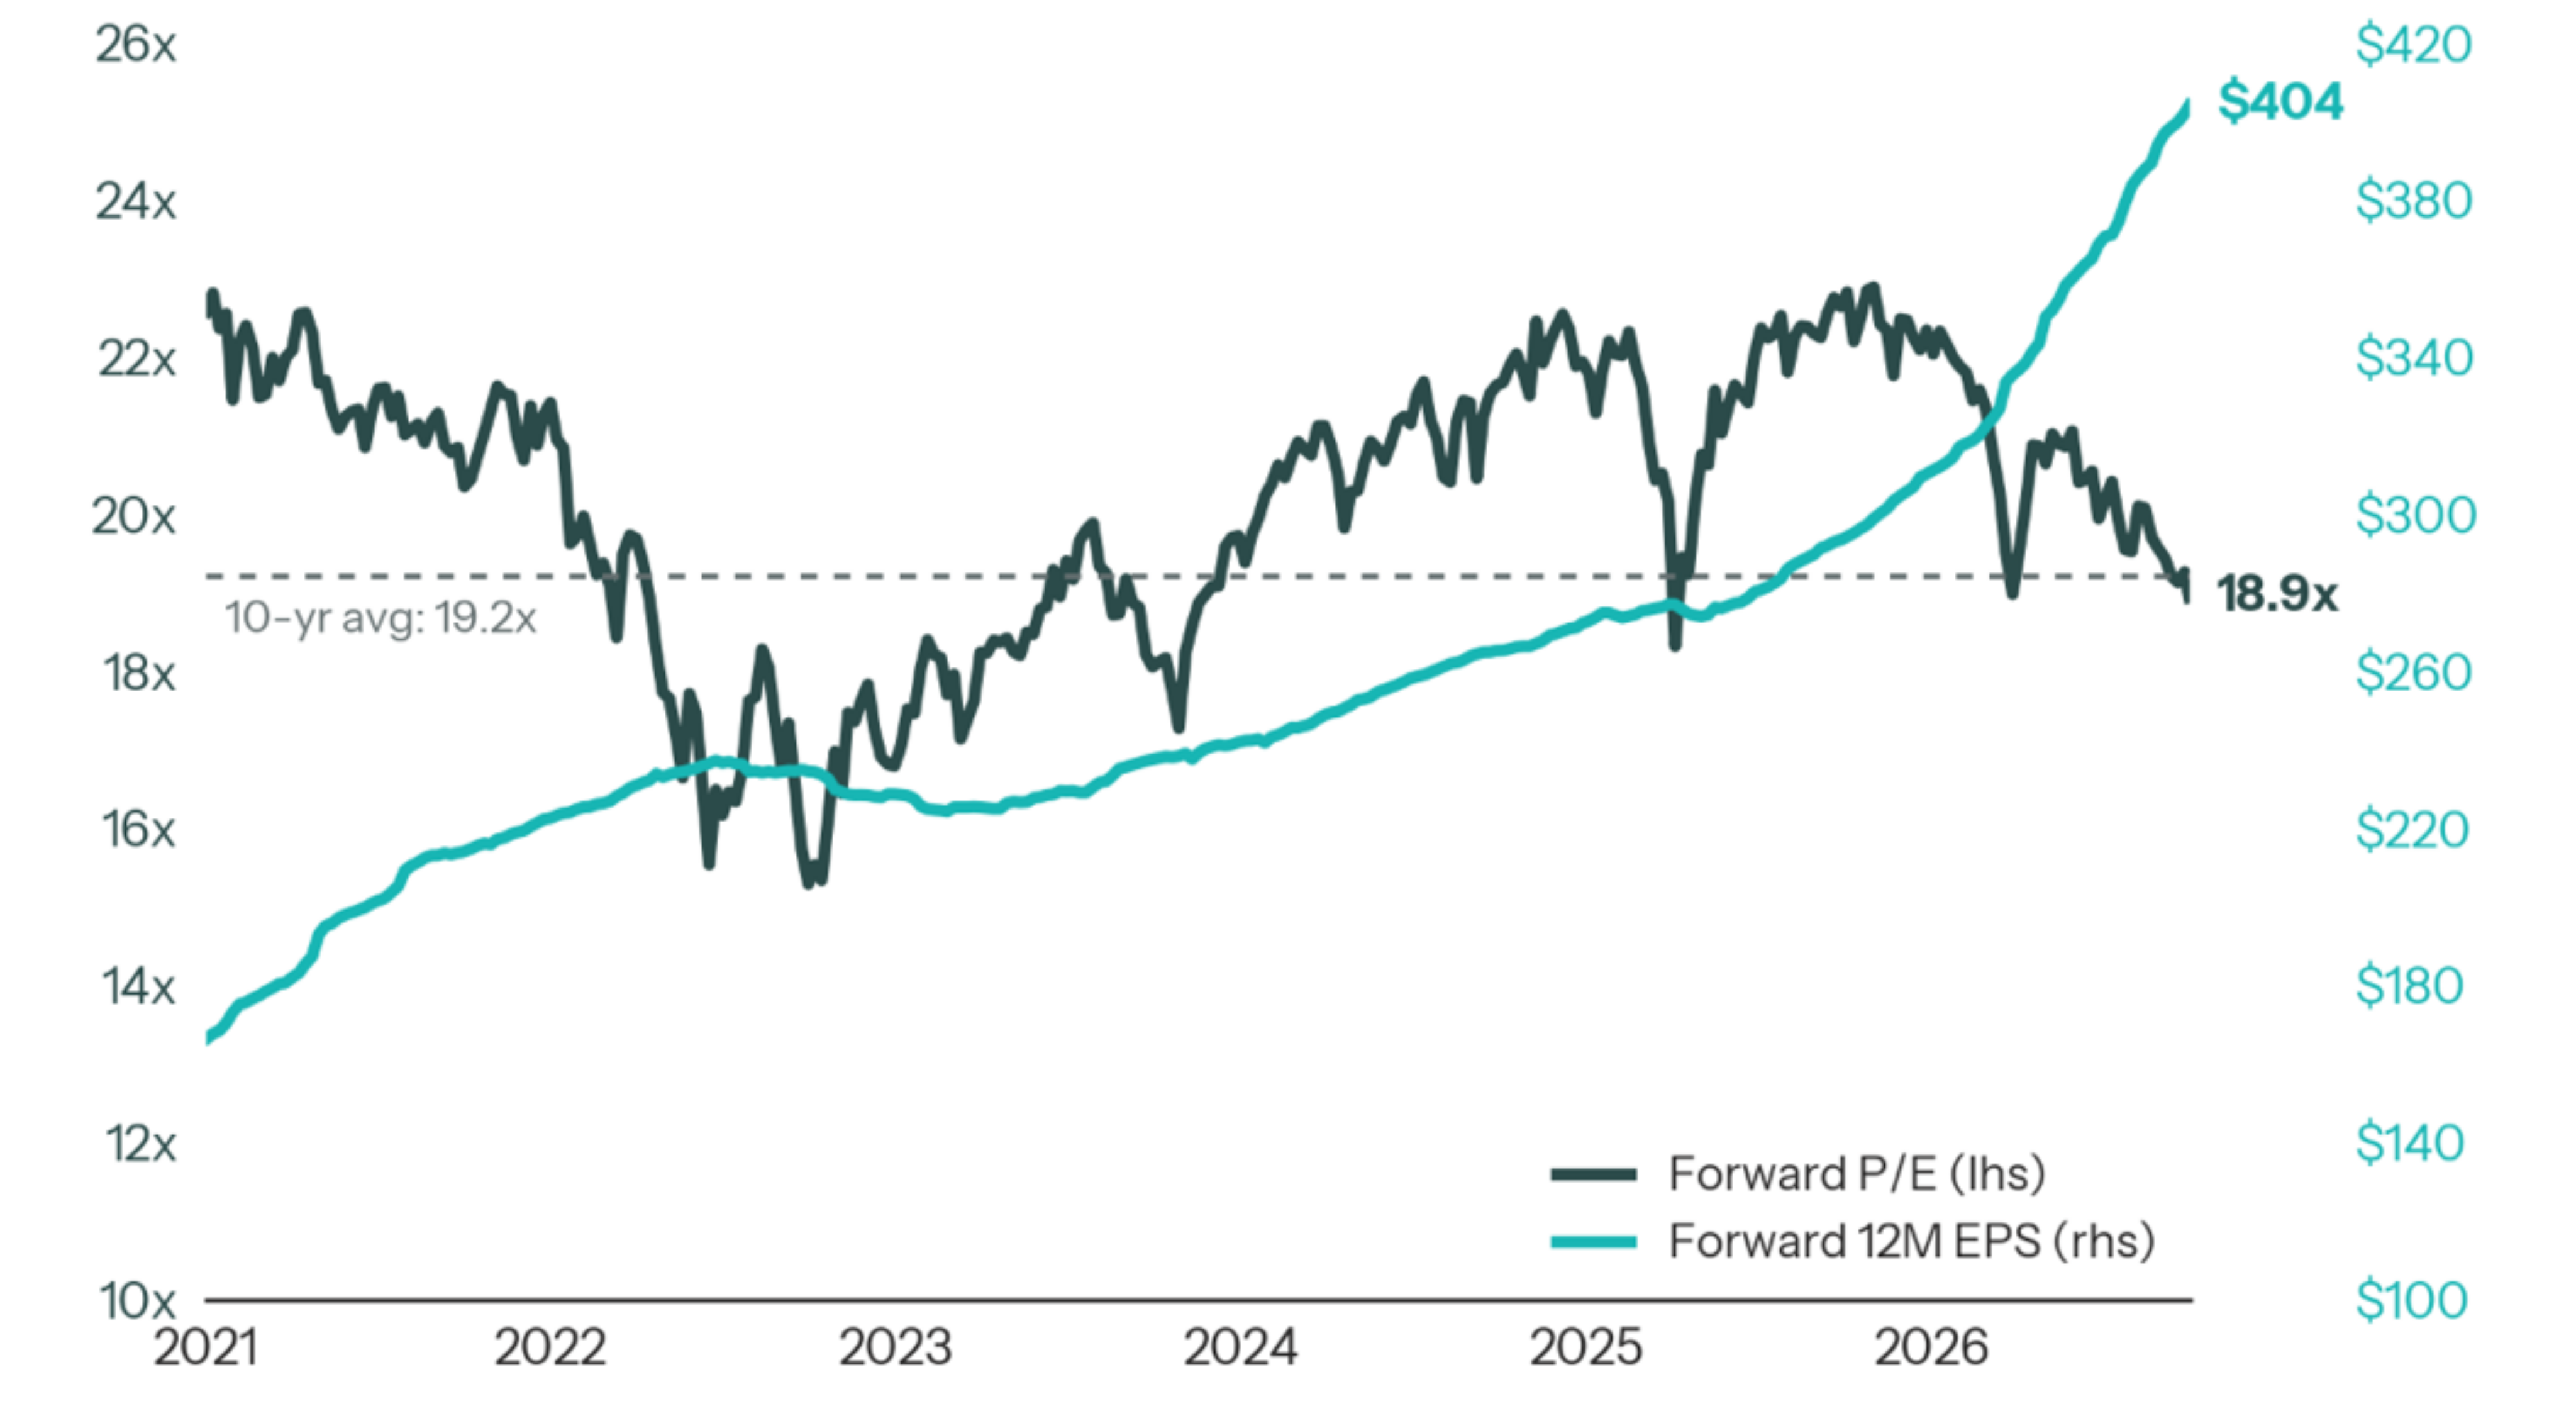
Source: Bloomberg. As of 9/30/2026.
Looking Ahead
The third quarter served as another test for the U.S. economy, following the rate shock of 2022, the tariff disruption of 2025, and the energy shock of Q1 2026. So far, the economy has absorbed higher energy costs and a sharp increase in long-term interest rates without a meaningful slowdown in activity. In our view, the drivers of that resilience remain in place. The largest technology companies continued to raise their capital spending plans, consumer spending held up despite higher prices, and the labor market avoided the broad-based layoffs that typically accompany a downturn. Barring a sharp further increase in interest rates or a meaningful pullback in AI investment, we believe the economy remains on solid footing.
That said, risks remain elevated. The duration of the disruption in energy markets will likely determine how long inflation stays above the Fed’s target and how far the Fed ultimately raises rates. Higher rates have already weighed on housing and the more rate-sensitive areas of the equity market, and a disappointment in AI spending could pressure the largest companies that have driven index returns, with likely spillover effects on consumer spending and employment. Given the difficulty of predicting how these dynamics will unfold, Simon Quick continues to emphasize building portfolios that are diversified across asset classes and risk factors.
Sources
[1] https://www.cmegroup.com/markets/interest-rates/cme-fedwatch-tool.html
[2] https://www.iea.org/reports/oil-market-report-september-2026
[3] https://www.bls.gov/news.release/cpi.nr0.htm
[4] https://www.bls.gov/news.release/cpi.nr0.htm
[5] https://www.census.gov/retail/marts/www/marts_current.pdf
[6] YCharts
Disclaimer
This material is provided for informational and educational purposes only and is not intended as, and should not be construed as, legal, tax, or accounting advice. The information contained herein is based on sources believed to be reliable; however, Simon Quick Advisors, LLC (“Simon Quick”) makes no representations or warranties as to its accuracy, completeness, or suitability for any particular purpose, and the information may change without notice.
Simon Quick is a registered investment adviser but is not a law firm or an accounting firm. Simon Quick does not provide legal or tax advice, does not interpret state residency statutes or regulations, and does not represent clients in residency audits, tax disputes, or other legal proceedings. State residency rules are complex, fact-specific, and subject to varying interpretations by taxing authorities.
Clients should consult with qualified legal counsel, state and local tax professionals, or certified public accountants regarding their specific circumstances, including the steps necessary to establish domicile, reduce potential exposure to state taxation, and prepare any required filings. Any actions taken or decisions made based on this material are the sole responsibility of the recipient.
Simon Quick may only transact business, or render personalized investment advice, in those states and jurisdictions where it is properly registered or otherwise exempt from registration. This communication does not constitute an offer to provide advisory services in any jurisdiction where Simon Quick is not registered or exempt.
Simon Quick Advisors, LLC (“Simon Quick”), together with its affiliates, officers, employees, and related persons, may have financial or other interests that could conflict with the interests of clients, including compensation arrangements, referral relationships, or interests in the products or strategies discussed herein. Simon Quick addresses these conflicts through its policies and procedures. Clients and prospective clients are encouraged to review Simon Quick’s Form ADV Part 2A for a complete description of material conflicts of interest, available upon request or through the SEC’s Investment Adviser Public Disclosure website.
Receipt or review of this document does not create an advisory, legal, tax, or fiduciary relationship beyond the scope of your existing engagement with Simon Quick.
This presentation is for informational purposes only and is intended solely for the recipient. It does not constitute an offer to sell or a solicitation of an offer to buy any securities, which may only be made pursuant to the fund’s offering documents.
Any performance targets, projections, or expectations presented herein are hypothetical and are not based on actual investment results. Such targets are provided for illustrative purposes only, are subject to significant limitations, and are not guarantees of future performance. Actual results may differ materially.
Investments in the strategy involve a high degree of risk, including the use of leverage, which can magnify gains and losses. There can be no assurance that the strategy will achieve its investment objectives or that investors will avoid losses.
Any discussion of tax benefits is general in nature, is based on current tax laws and interpretations (which are subject to change), and may not be applicable to all investors. Tax outcomes will vary depending on individual circumstances. Prospective investors should consult their own tax advisors.
Past performance, where referenced, is not indicative of future results. Diversification and low correlation do not guarantee profits or protect against losses. Simon Quick Advisors, LLC (“Simon Quick”) is an SEC-registered investment adviser with a principal place of business in Morristown, NJ. A copy of our written disclosure brochure discussing our advisory services and fees is available upon request. References to Simon Quick as being “registered” do not imply a certain level of education or expertise.
Certain information contained herein may be “forward-looking” in nature. Due to various risks and uncertainties, actual events or results or the actual performance of the Fund may differ materially from those reflected or contemplated in such forward-looking information. As such, undue reliance should not be placed on such information. Forward-looking statements may be identified by the use of terminology including, but not limited to, “may,” “will,” “should,” “expect,” “anticipate,” “target,” “project,” “estimate,” “intend,” “continue” or “believe” or the negatives thereof or other variations thereon or comparable terminology.