The One Percenters
It was only a short quarter ago when we wrote about the collapse in prices for risk assets as the world came to grips with the devastation that COVID-19 would have on the global economy. I recall sitting in my makeshift office/bedroom watching the Dow violently swing hundreds of points into the red as Governor Cuomo interrupted my regularly scheduled Bloomberg programming to provide the latest update on spiking hospitalization rates and the inversely correlated availability of PPE and ventilators. The sirens of passing ambulances were the only thing I’d hear outside my window on an otherwise deserted street for weeks. Lysol disinfectant, 3M N95 masks, and Charmin Ultra Soft were the new precious commodities being traded on my Facebook groups.
As we enter the second half of a tumultuous year, we’ve certainly become acclimated to this new environment. My wife designs face masks as a hobby, my children know all the keyboard shortcuts for Zoom calls and how to alt-tab their Roblox game behind their summer reading schedules, and I now have a proper work space, still in my bedroom, but where my unmade bed is now out of view during videoconferences.
Capital markets have recovered meaningfully as well, supported by a fast moving Federal Reserve and a Congress that flooded the market with liquidity to stabilize the financial system and got money into the hands of small businesses and the newly unemployed to soften the blow of a shuttered economy. Fueled by hopes of a potential vaccine and the gradual re-opening of businesses, stocks are clawing back from their 30%+ drawdown through March and are now hovering around breakeven returns for the year. While international markets have lagged the U.S., even they have experienced a strong recovery, fueled by a late-quarter rally in emerging markets, as China reported surprise positive GDP growth in the second quarter.
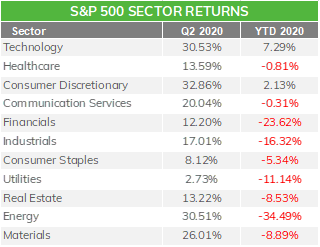
Once again, growth stocks, particularly in technology and tech-enabled businesses, have been the leaders behind the rally. As a proxy to such businesses, the NASDAQ has returned 12% so far this year, rallying 30% in the quarter. Information Technology, as a sector, has generated over 7% in the first half of the year, followed by Consumer Discretionary at over 2%. Amazon, with a $1.5tn market cap, is the category-killer, comprising over a third of the weighting of that entire sector and retuning over 50% this year. Many can appreciate the value that Amazon has provided in this socially distant season, whether it be through grocery delivery, providing Work From Home equipment (computer monitors and stretchy pants), or visiting Netflix, LinkedIn, and Facebook, all of whom are Amazon Web Services customers.
Source: Bloomberg
While Amazon is considered a retailer, their use of technology to suggest products to customers, execute on efficient delivery logistics, and provide digital content for evenings at home, has been the driving force behind the company’s success, despite the weakening economy. The FAAMGs (Facebook, Amazon, Apple, Microsoft, Google) broadly have been dominant factors in this market rally. I’ll refer to them as the “One Percenters”, as they are only one percent of the S&P 500 by count (five companies out of technically 505 constituents in the index). While they are only a handful of companies, they command over 20% of the weight of the index and average approximately $1tn in market capitalization each. Combined, the One Percenters are bigger than the total of the next twenty companies in the index. These stocks were up anywhere between 7% (Google) and 50% (Amazon) in the first half of 2020 and contributed over 5 positive points of return to the index that was down about 3%. In other words, the One Percenters were significant drivers of the equity market recovery. Excluding them, the rally has been more muted for the broader pool of constituents, as the Equal Weight index for the S&P500 lagged around 7 points behind the more popular capitalization-weighted index at -10.8% for the first half of the year.

Source: Bloomberg
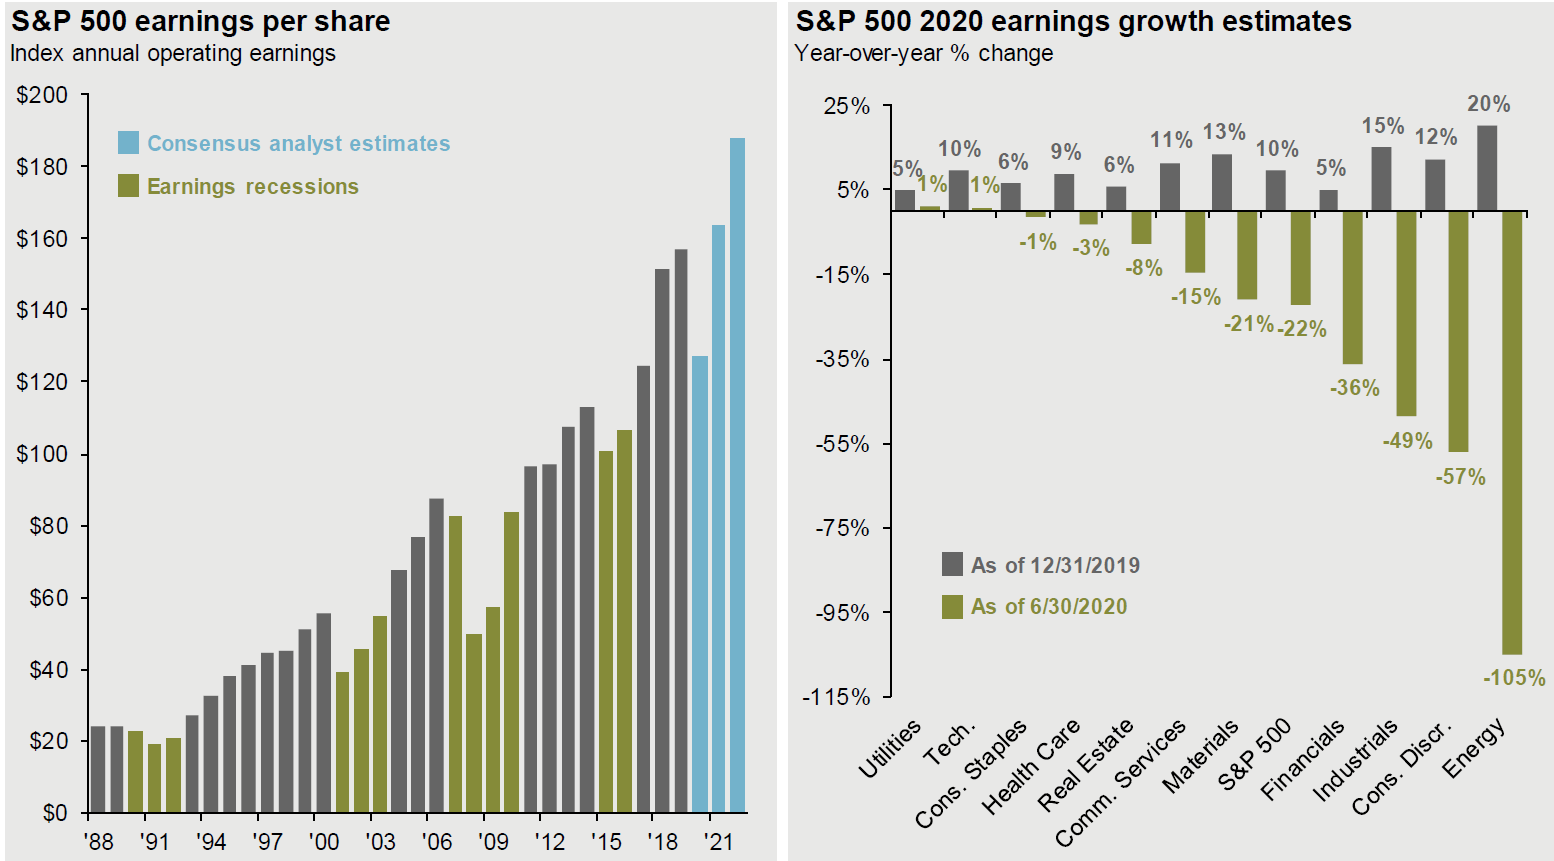
Economically, we are not yet out of the woods, as the more cyclical sectors, such as Financials, Industrials, and Materials remain the worst-performing segments of the market. We exclude the Energy sector, which had another supply-demand shock right before the economic shut-down and is by far the largest outlier to the downside. Small cap stocks (a la the Russell 2000) provide a more appropriate picture of “Main Street” America and were lagging the S&P 500 by almost 10% through the end of the second quarter.
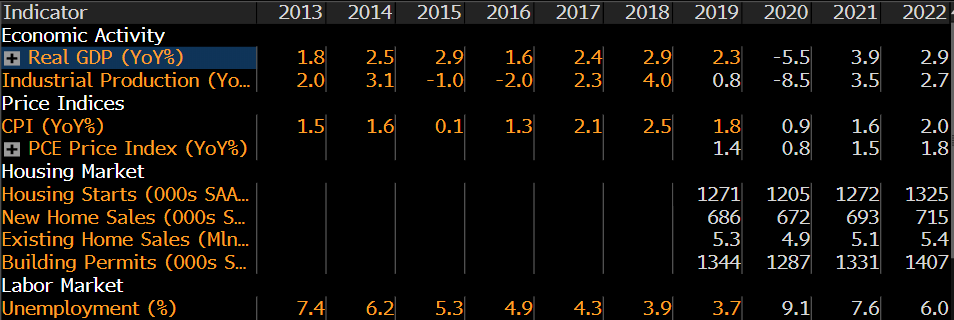
We are now looking at a mid-single digit decline in GDP, with unemployment forecasted to end in the high-single digits by the end of the year, but off its near-15% recent peak. In comparison, following the global financial crisis, GDP was -2.5% and unemployment at 10% at the end of 2009.
US Full-Year Economic Forecasts
Source: Bloomberg
While storefronts and restaurants are slowly re-opening and supply chains are now flowing, these are still at limited capacities. After the initial spike in the macro data, we expect the longer-term recovery to be more gradual and peppered with pockets of distress for the next couple years. Manufacturing remains stuck below levels prior to the start of trade tensions with China in 2018. The services sector, notably in the travel and leisure space, are significantly handicapped with the drop-off in demand. The negative effects of the recession will continue, as landlords are only beginning to see the damage of heightened unemployment, business closures, and the fall-off of off-campus housing and senior living facilities in their rent collections. There will be a wave of bankruptcies over the next few quarters across these sectors, driving a default rate estimated to be in the low double-digits, similar to levels seen in the prior two recessions.
We’re not naïve to the eventuality of a recovery. History shows that right after 9/11 and into the 2001 recession, people were also afraid to fly and travel, but frankly, that was likely the time to be buying real estate to build a casino or hotel. We also appreciate that a trip to Disney World is likely deferred, not cancelled. However, it will be the innovators who survive and thrive, not the businesses that are relying on “business as usual” to make it through this recession. We continue to lean into technology as a growth driver to move companies and markets forward. We also expect there to be a separation of winners and losers across all industries, and buying for “value” based mainly on its cheapness to its peers will not be enough to protect investments in the transitioning business cycle.
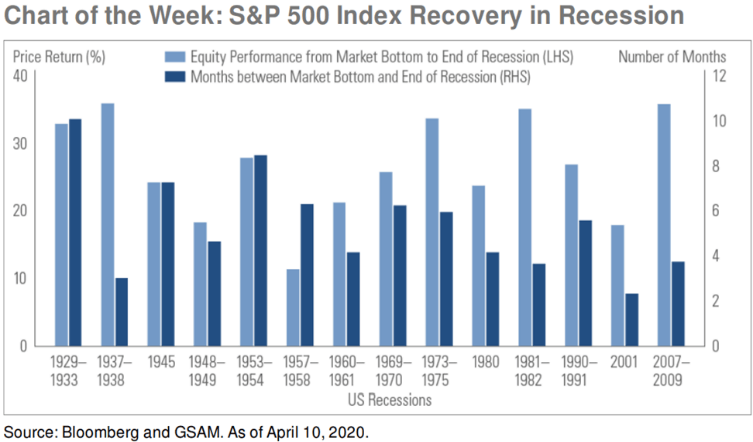
Source: Goldman Sachs
Despite the Recession, Not a lot is on Sale
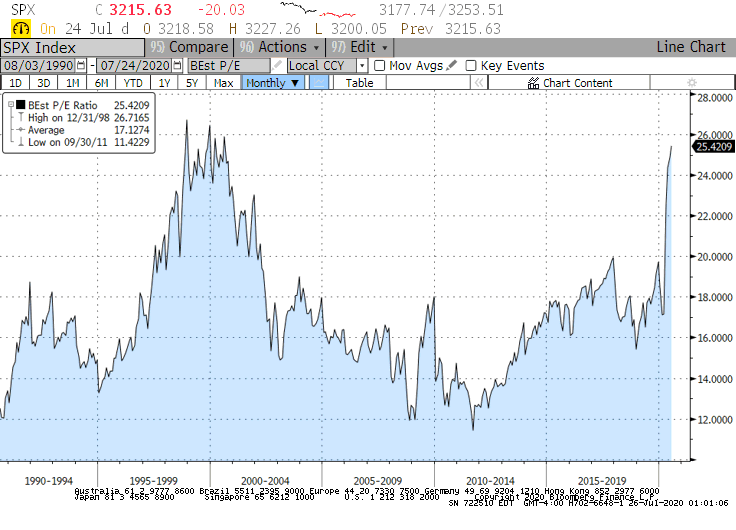
We entered 2020 with a Forward Twelve Month P/E multiple of 19.7x on the S&P. Fed Funds were at about 1.5%, with inflation slightly above 2%. In the midst of the market collapse in March, multiples visited the 14x level, but their stay was short-lived. As of second quarter end, Forward P/E multiples are now at about 25x. These are Tech-bubble levels, but before we hit the panic button, let’s recall that Fed Funds were in the 5-6.5% range in a mid-3% inflationary environment as the markets were hitting those lofty levels during an expansionary period. What we’re seeing today echoes the 2008 recession, where the S&P P/E of 15x collapsed to under 12x in December of that year, before rallying to 19x at the end of 2009. Fed Funds had peaked at 5% in 2007 before falling to zero in the crisis.
Source: Bloomberg
In that recession, investors had to look beyond depressed near-term profits (which could make valuations look expensive) and buy into the long-term earnings potential of companies through a multi-year business cycle. We believe the same transition is occurring today. 2020 earnings will be severely depressed, but as we look towards a zero-bound interest rate environment in 2021 and 2022, with societies and businesses further evolved in a COVID-influenced world, multiples become more reasonable. We recognize the return potential may be more dampened, and thus stock selection becomes ever more important, but we do not see this as a bubble. Quality of earnings and trajectory of growth will remain key during this period in building and maintaining conviction in asset allocation and manager selection.
Source: JPMorgan
Where we do see exceptional value is in structured and distressed credit. While the opportunity in a liquidity-driven sell-off is behind us, fundamentally challenged companies that need rescue capital or a restructuring can offer attractive entry levels and return potential for the patient investor. Additionally, the pool of instruments trading at a discount to principal value has increased, allowing for the natural accretion of value to par to occur. Structured credit, apart from the highest rated tranches, has lagged the traditional credit market recovery, due to its complexity and illiquidity, and thus offers investors similar opportunities as well. We continue to allocate to this space for the attractive return potential over the next couple years.
Research Spotlight: The love story of Technology and Healthcare
Healthcare is the second largest sector in the S&P, at around 15% of the index. While significant in size, it is a slower growing, lower volatility, lower valued, part of the economy in comparison to the larger, flashier, Technology complex. However, the rise of COVID-19 has highlighted the need of rapid medical response and innovation to address the current and potential future outbreaks. Drug discovery is key, alongside commercialization and delivery. This is a high risk, high return segment of healthcare as treatments that fail clinical trials can destroy capital and time, however, successful commercialization of effective medicines can result in multiples of return on invested capital. The risk profile of biotechnology is similar to that of venture capital, however exponentially more complex in the science. We have recently approved an investment with a manager that has built a team of researchers, investors, and business-builders to extract value in the space. The manager has been successfully operating its investment process for over a dozen years, resulting in compelling performance, while also providing diversification to the Technology and Healthcare sectors, as well as the broader stock indices. Please reach out to us to further discuss this opportunity and how it may be complementary to your portfolio.
Asset Allocation
Equities: Target-Weight
Large cap equities are pricing in a “V”-shaped recovery from the COVID trough experienced in March. Technology, and technology-enabled companies (such as Amazon (shopping), Netflix (media), and Tesla (cars) for example) have actually catapulted from the crisis to reach all-time highs as remote work and play, and distanced logistics and supply-chain businesses have further emphasized their value to corporations and consumers. However, these are the select “haves” in the [S&P 500] index with significantly more “have nots” that represent the broader economy that have not enjoyed the same fundamental and capital markets appreciation. We expect the economic recovery to continue, but recognize that it will be choppy. Stock valuations have pulled forward a lot of future earnings growth and a presumption of pent-up demand to backfill first quarter revenue losses. As such, we anticipate equities to be more skittish around news flow that may threaten the path of growth: roll-backs of reopening plans, ending of fiscal stimulus, potential for a new federal administration, and increasing diplomatic tensions, to name a few.
We recognize that valuations are stretched. We also note that this is due to earnings being artificially low relative to long-term expectations and a zero-bound interest rate policy. However, we feel that the risk/reward between fundamentals and price is more balanced today and harder to call the direction of the market than when we were underweight stocks at the beginning of the year, and in the midst of adding to the asset class in the throes of the 30%+ sell-off. Thus, we remain staunchly focused on quality businesses that show stable earnings and cash flow growth even in a tepid recovery, rather than lean into more cyclical companies that popped in the quarter but are reliant on a continued sharp recovery. Technology as a long-term theme, and companies that adapt and innovate their businesses to utilize it, continues to be an area of focus, as it is mission-critical for them if they wish to stay relevant with their customers and continue to grow. We remain underweight “Value” stocks, specifically in cyclical sectors, as well as smaller cap companies that lack the robustness of balance sheet and revenue generation. While underweight international exposures, the managers we are with maintain a quality-oriented growth focus, similar to our domestic allocations.
Fixed Income: Underweight
Fixed income outperformed the market sell-off in the first quarter and continued to rally in the second. Rate-sensitive bonds and investment grade credit is positive on the year. We had reduced our weighting to “under-weight” in order to re-allocate to Equities and Alternatives, as Fed Funds fell to zero and a bazooka of monetary and fiscal policy stimulated markets and the economy. Currently, within our under-weight recommendation, we are rotating capital towards credit and structured credit risk and away from interest rate sensitivity. The lag in credit recovery in the quarter, relative to equities, presents an opportunity for further spread tightening in levered loans, corporate bonds, and structured credit. The “pull to par” effect should also be supportive to credits that are now trading at a discount.
Liquid Alternatives: Overweight
We remain constructive on hedge funds in the current environment as managers can take a more targeted approach towards investments and are seeing greater opportunities on both longs and shorts. Larger gross exposures, while maintaining low net exposures, can generate meaningful alpha opportunities while also protecting in a choppier market. Arbitrage strategies have seen an expansion in spreads, which should result in better returns overall, without taking greater directional risk. In equities, we remain convicted in our systematic and biotech-focused funds. Structured and distressed credit managers are also a significant area of focus today, given the expanded opportunity set for managers to participate in through the recession.
Illiquid Alternatives: Overweight
We remain overweight illiquid alternatives given their longer investment periods and ability to extract value through active engagement with their portfolio companies. An economic recession will impact private businesses along with their public peers, however the control held by our managers in executing on operational change and revenue growth can drive true fundamental value creation during the holding period. Additionally, valuations are driven less by technical factors exhibited in public markets, as the majority of investors are holding and engaging with the companies over multiple years, rather than looking for a short-term gain. We recognize that cyclically sensitive businesses will be the most impacted during this time, but this can also create opportunity for funds currently raising capital to deploy into. Over an investment cycle, private equity investments should generate materially stronger returns over public markets in exchange for longer holding periods. We are recommending allocations to credit dislocation funds, buy-out, and venture opportunities today.
Do you have any questions regarding this content? We would love to chat!
Important Disclosures
This information is for general and educational purposes only. You should not assume that any discussion or information contained herein serves as the receipt of, or as a substitute for, personalized investment advice from Simon Quick Advisors & Co., LLC (“Simon Quick”) nor should this be construed as an offer to sell or the solicitation of an offer to purchase an interest in a security or separate accounts of any type. Asset Allocation and diversifying asset classes may be used in an effort to manage risk and enhance returns. It does not, however, guarantee a profit or protect against loss. Investing in Liquid and Illiquid Alternative Investments may not be suitable for all investors and involves a high degree of risk. Many Alternative Investments are highly illiquid, meaning that you may not be able to sell your investment when you wish. Risk of Alternative Investments can vary based on the underlying strategies used.
Please remember that past performance may not be indicative of future results. Different types of investments involve varying degrees of risk, and there can be no assurance that the future performance of any specific investment, investment strategy, or product (including the investments and/or investment strategies recommended or undertaken by Simon Quick), or any non-investment related content, made reference to directly or indirectly in this newsletter will be profitable, equal any corresponding indicated historical performance level(s), be suitable for your portfolio or individual situation, or prove successful. Due to various factors, including changing market conditions and/or applicable laws, the content may no longer be reflective of current opinions or positions. To the extent that a reader has any questions regarding the applicability of any specific issue discussed above to his/her individual situation, he/she is encouraged to consult with the professional advisor of his/her choosing. Simon Quick is neither a law firm nor a certified public accounting firm and no portion of the newsletter content should be construed as legal or accounting advice. If you are a Simon Quick client, please remember to contact Simon Quick, in writing, if there are any changes in your personal/financial situation or investment objectives for the purpose of reviewing/evaluating/revising our previous recommendations and/or services. Simon Quick Advisors, LLC (Simon Quick) is an SEC registered investment adviser with a principal place of business in Morristown, NJ. Simon Quick may only transact business in states in which it is registered, or qualifies for an exemption or exclusion from registration requirements. A copy of our written disclosure brochure discussing our advisory services and fees is available upon request. References to Simon Quick as being “registered” does not imply a certain level of education or expertise.
This newsletter and the accompanying discussion include forward-looking statements. All statements that are not historical facts are forward-looking statements, including any statements that relate to future market conditions, results, operations, strategies or other future conditions or developments and any statements regarding objectives, opportunities, positioning or prospects. Forward-looking statements are necessarily based upon speculation, expectations, estimates and assumptions that are inherently unreliable and subject to significant business, economic and competitive uncertainties and contingencies. Forward-looking statements are not a promise or guaranty about future events.
Economic, index, and performance information herein has been obtained from various third party sources. While we believe the source to be accurate and reliable, Simon Quick has not independently verified the accuracy of information. In addition, Simon Quick makes no representations or warranties with respect to the accuracy, reliability, or utility of information obtained from third parties.
Historical performance results for investment indices and/or categories have been provided for general comparison purposes only, and generally do not reflect the deduction of transaction and/or custodial charges, the deduction of an investment management fee, nor the impact of taxes, the incurrence of which would have the effect of decreasing historical performance results. It should not be assumed that your account holdings correspond directly to any comparative indices or benchmark index, as comparative indices or benchmark index may be more or less volatile than your account holdings. You cannot invest directly in an index.
Indices included in this report are for purposes of comparing your returns to the returns on a broad-based index of securities most comparable to the types of securities held in your account(s). Although your account(s) invest in securities that are generally similar in type to the related indices, the particular issuers, industry segments, geographic regions, and weighting of investments in your account do not necessarily track the index. The indices assume reinvestment of dividends and do not reflect deduction of any fees or expenses.
Please note: Indices are frequently updated and the returns on any given day may differ from those presented in this document. Index data and other information contained herein is supplied from various sources and is believed to be accurate but Simon Quick has not independently verified the accuracy of this information.