
Let’s Meet, on Your Terms
No pressure, no obligations — just an open conversation about your goals.


We are entering the final stretch of 2026 in a year that has supported economic growth and equity market resilience. This has been achieved despite the challenges of an oil shock from the still unresolved Middle East conflict and continued tariff tensions with our trading partners. Both contributing factors have kept inflation well above the Federal Reserve’s long-term target of 2%. Nonetheless, shrugging off this inflationary headwind, consumers have continued to spend, supported by a stable job market and low unemployment. Second quarter corporate earnings were strong as well, extending a seven-quarter streak of double-digit profit growth. These conflicting factors, earnings strength, and inflationary pressure, can arguably be traced back to the same underlying driver: that is the AI adoption and its investment cycle. As generative AI continues to advance, businesses are scrambling to stay current and integrate this technology into their own organizational processes in pursuit of further productivity gains and new revenue opportunities. Individuals are also turning to it more each day to manage their personal lives as a dedicated personal assistant in ways that Siri or Alexa never achieved. The broadening of AI utilization and the desire by its creators to stay on the cutting edge of model capability and deployment are the core driver behind this year’s economic growth. Large scale capital investment necessary to fuel AI advancement has also diverted labor, power, materials, and technology from other uses, creating scarcity in the rest of the economy, and driving higher prices.
Let’s be a little more specific as to where AI is showing up across the market. The Magnificent Seven, notably Nvidia, Google, Meta, and Microsoft, were the early public market drivers of the AI opportunity. They are all technology-oriented businesses commanding high valuations for their rapid growth as AI enablers since the launch of ChatGPT in 2022. This year, the beneficiaries have broadened into other segments of the technology industry, notably in hardware and semiconductors, as demand for computing capacity to power the models has grown rapidly with user adoption. Other sectors have also seen accelerated growth and multiple expansion due to AI, such as industrial businesses that build chip-manufacturing equipment, data centers, and related infrastructure. Even a historically sleepy sector like utilities, long one of the lowest-correlation, lowest-volatility corners of the market, is now tied to the AI buildout as they invest heavily in the power grid and transmission infrastructure to meet the demands of data center energy needs, driving investor interest and valuations higher. Commodities, as the raw materials used to build and power data centers and the chips residing in them, show a similar pattern of price appreciation for copper, natural gas, and even nuclear power. The AI investment theme has also gone global, as we are seeing similar dynamics in Asia, most visibly in South Korea, where demand for memory chips has powered Samsung and SK Hynix to drive a massive rally in the country’s stock market. Along with Taiwan Semiconductor, these chipmakers have driven much of the year’s run in emerging market equities on the same AI theme.
While AI-related companies have partially funded these large-scale investment plans with cashflow and stock sales, the size and scale of the investments necessitate that they also access the credit markets for cheaper financing via private loans and bond issuance. Municipal bonds are also seeing some of this impact as AI-tied infrastructure plans seek funding. Technology companies, which were historically lightly levered and underrepresented in bond indices relative to their market capitalization, have been raising debt as a form of cheaper financing, and investors have been happily lending to them.
What this means is that an investor can hold what looks like five distinct risk buckets (technology, industrials, utilities, emerging markets, and credit) and still be making a version of the same bet on AI. To be clear, we recognize the benefits of AI in our professional and personal lives and expect it to be as impactful as cell phones and the internet. However, we also recognize that the intertwining of industries to the same growth factors makes it harder to hedge against inevitable speedbumps in the economy and the risk it brings as AI’s influence expands. A sharp deceleration in the AI capex cycle or the growing concern of a slowdown could hit equities, credit, and commodities simultaneously, leaving little room for investors to hide.
The Hedge That Isn’t
Traditionally, the simplest way to diversify equities was through a bond allocation. The classic 60/40 portfolio is based on the expectation that when stocks fall, bonds rise. Defensive, counter-cyclical bonds would smooth out the volatility of stocks and result in more consistent, long-term returns. However, that premise took a beating in 2022 when the S&P 500 fell 18%, but bonds, as represented by the Bloomberg U.S. Aggregate Index, also declined 13%, the worst year in the index’s history. Maybe it was a one-time aberration due to the markets coming off a period of very low rates from COVID-era easy monetary policy into a sudden inflationary spike and rapid, reactive interest rate hiking cycle. With interest rates today hovering at meaningfully higher levels, just under 4% and 10-year Treasuries recently topping 5%, such levels of losses from bonds should not recur, even if we see a couple of interest rate hikes in the coming months. We would actually argue that these are attractive yields from a coupon-clipping perspective. Rather, our concern is that bonds may be less effective in serving as a hedge and protecting portfolios from an equity market sell-off the way they once did, as bonds now seem to be reacting to market factors in the SAME direction as stocks.
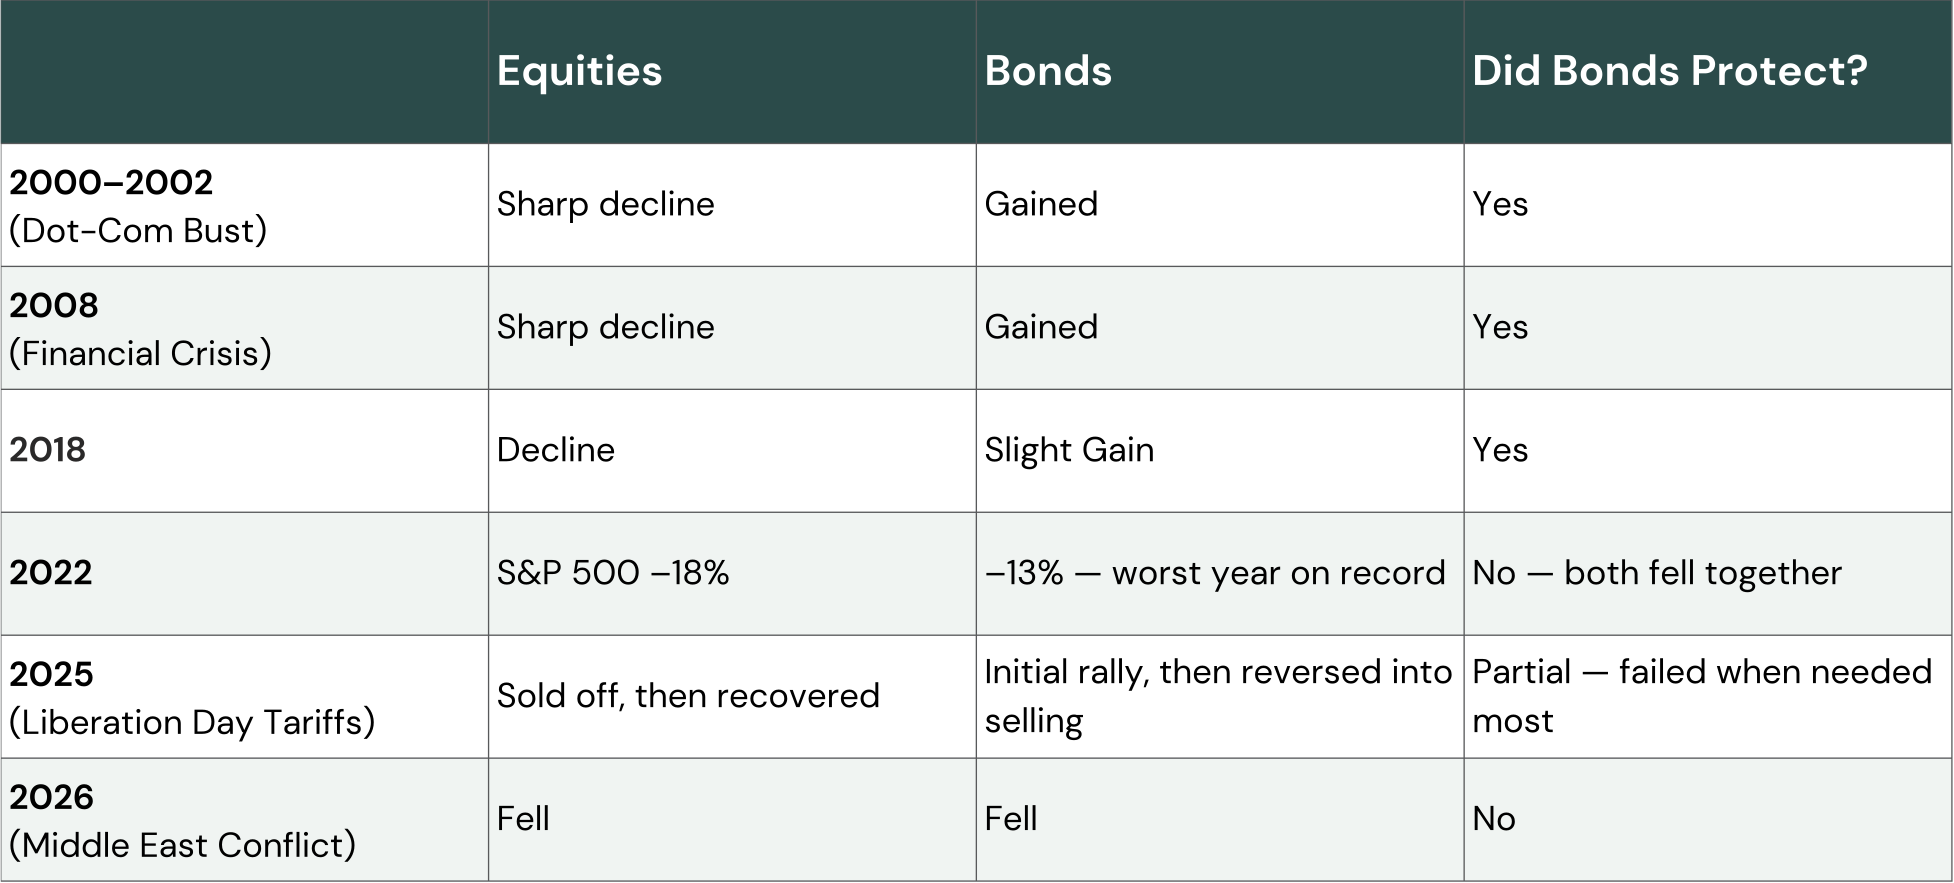
The simplest way to see this is by tracking whether bonds protected when stocks sold off over different periods of time. From 2000 through 2020, stocks and bonds didn’t move in opposite directions every year, but when equities did have their worst years, bonds were reliably positive: 2000 through 2002 (the dot-com bust), 2008 (the financial crisis), and 2018 all saw stocks fall while bonds gained or at least protected from loss. This pattern then broke and has stayed broken since 2022 as we saw both assets fall together (stocks -18%, bonds -13%), then again in the 2025 and 2026 equity market sell-offs. Following the Liberation Day tariff announcement in April 2025, bonds initially worked as expected while stocks sold off, as investors piled into Treasuries and yields fell. But days later, bonds reversed into sustained selling while stocks kept falling until tariffs were paused a little more than a week later. While stocks and bonds eventually recovered and went on to deliver positive returns for the full year, bonds did not protect in the period when stocks needed them most. Even earlier this year, the initial market response to the Middle East conflict resulted in stocks and bonds both falling rather than triggering a flight to Treasuries and positive bond performance. Why bonds in these two events failed to protect can in part be attributed to heightened inflationary concerns despite the threat of slowing economic growth. As we look forward, we expect the momentum of AI investment to continue, but with that, higher inflation in the interim, and thus a consideration that monetary policy and bonds will be less reliable as a portfolio hedge.
Fed Chair Kevin Warsh used his inaugural Jackson Hole speech in late August to acknowledge that inflation is still not slowing at a pace the Fed is comfortable with, which may require policy action, likely through rate hikes. The bond market has taken these cues and pushed yields on Treasuries higher ahead of the September Fed announcement. While we expect bonds to be able to digest several rate hikes, the hedging support they provide against falling stocks will likely fall short. Furthermore, fiscal policy is not helping the cause as the government budget deficit continues to be large, pushing the national debt balance past $40 trillion and putting pressure on US treasuries. This played out in real time last month, with 30-year Treasury yields pushing up to a fresh 19-year high above 5.3%, with stocks pulling back alongside it. We have seen continued pressure on rates higher this month as a live illustration where, when yields rise for reasons unrelated to a strengthening economy (deficits, inflation, competing debt supply), equities also feel the pain and bonds fail to provide a cushion. If that is the case, reliance on bonds as a hedge to equities and AI risk may be ineffective and thus must be substituted with an alternative solution if investors seek to truly diversify risk.
What’s the Alternative
To be clear, we are not recommending that you sell out of equities, but rather highlighting that stocks are broadly moving to a similar drumbeat of AI, and the current inflationary environment makes it difficult for bonds to provide meaningful portfolio diversification. Thus, we need to consider alternatives to fixed income that have shown greater resiliency for generating attractive returns regardless of how stocks and bonds perform. Adding alternative assets just to create diversification is less valuable if those returns in isolation aren’t attractive as well. For example, an equity short strategy is a great hedge to stock market risk, but if the strategy can only be profitable in market selloffs and otherwise generate negative returns when markets are rising, which is typically the case, the cost of implementing that hedge may be worse than the benefit. Instead, when we consider alternative investments, the ideal is that they generate long-term returns that are meaningfully more attractive than traditional fixed income, have low sensitivity to the direction of the stock market, and in the ideal case, are strong performers when traditional investments like stocks and bonds may be selling off. Alternatives can come in various asset classes and strategies. At Simon Quick, we have typically utilized hedge funds, complemented by real estate investments and, more recently, commodities such as oil and gold, as core parts of our alternative solution set.
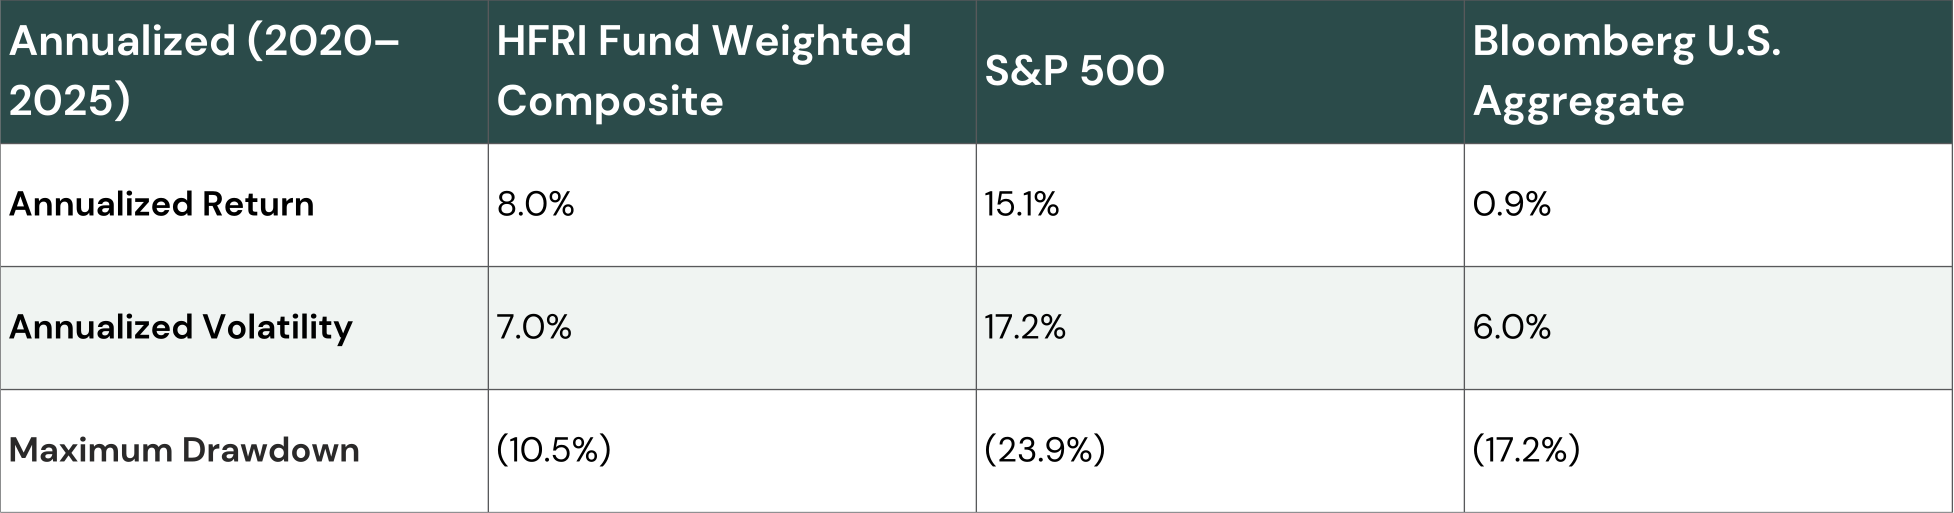
Hedge funds have had a long-standing allocation in portfolios for the main benefit of generating diversified steady returns when compared to stocks. When interest rates were low, hedge funds were also a replacement for fixed income as they would be able to deliver better performance than bonds while still providing diversification to equities. In a market like today, where higher interest rates allow for bonds to generate income but are also moving in a similar rhythm to stocks, we have shifted our hedge fund allocations into strategies that are less dependent on market direction and more notably could be protective in a market correction where inflation-driven market selloffs would less likely be protected by traditional bonds. Assuming we are successful at investing with high-quality hedge funds, their strategies can generate more consistent returns annually with less volatility than stocks, regardless of the direction markets move. The HFRI Fund Weighted Composite Index, our proxy for general hedge fund performance, includes more than 1,000 funds and spans over three decades of returns. The index has generated approximately 9% per year since inception through 2025, with volatility under 7%, which is less than half that of the S&P 500 volatility while capturing over 80% of the return. Similar returns with meaningfully lower volatility levels allow for investors to have greater confidence in performance expectations year in and out. To be fair, if we looked at comparable returns since 2020 through 2025, equities have had a tremendous run, annualizing at 15% per year, despite an 18% loss in 2022. However, hedge funds, over that same period delivered 8% with less than half the volatility. While absolute hedge fund performance has lagged stocks, the consistency of performance with volatility control is notable. In contrast, bonds have delivered less than a percent per year since 2020.
Source: Simon Quick research, Bloomberg, HFR
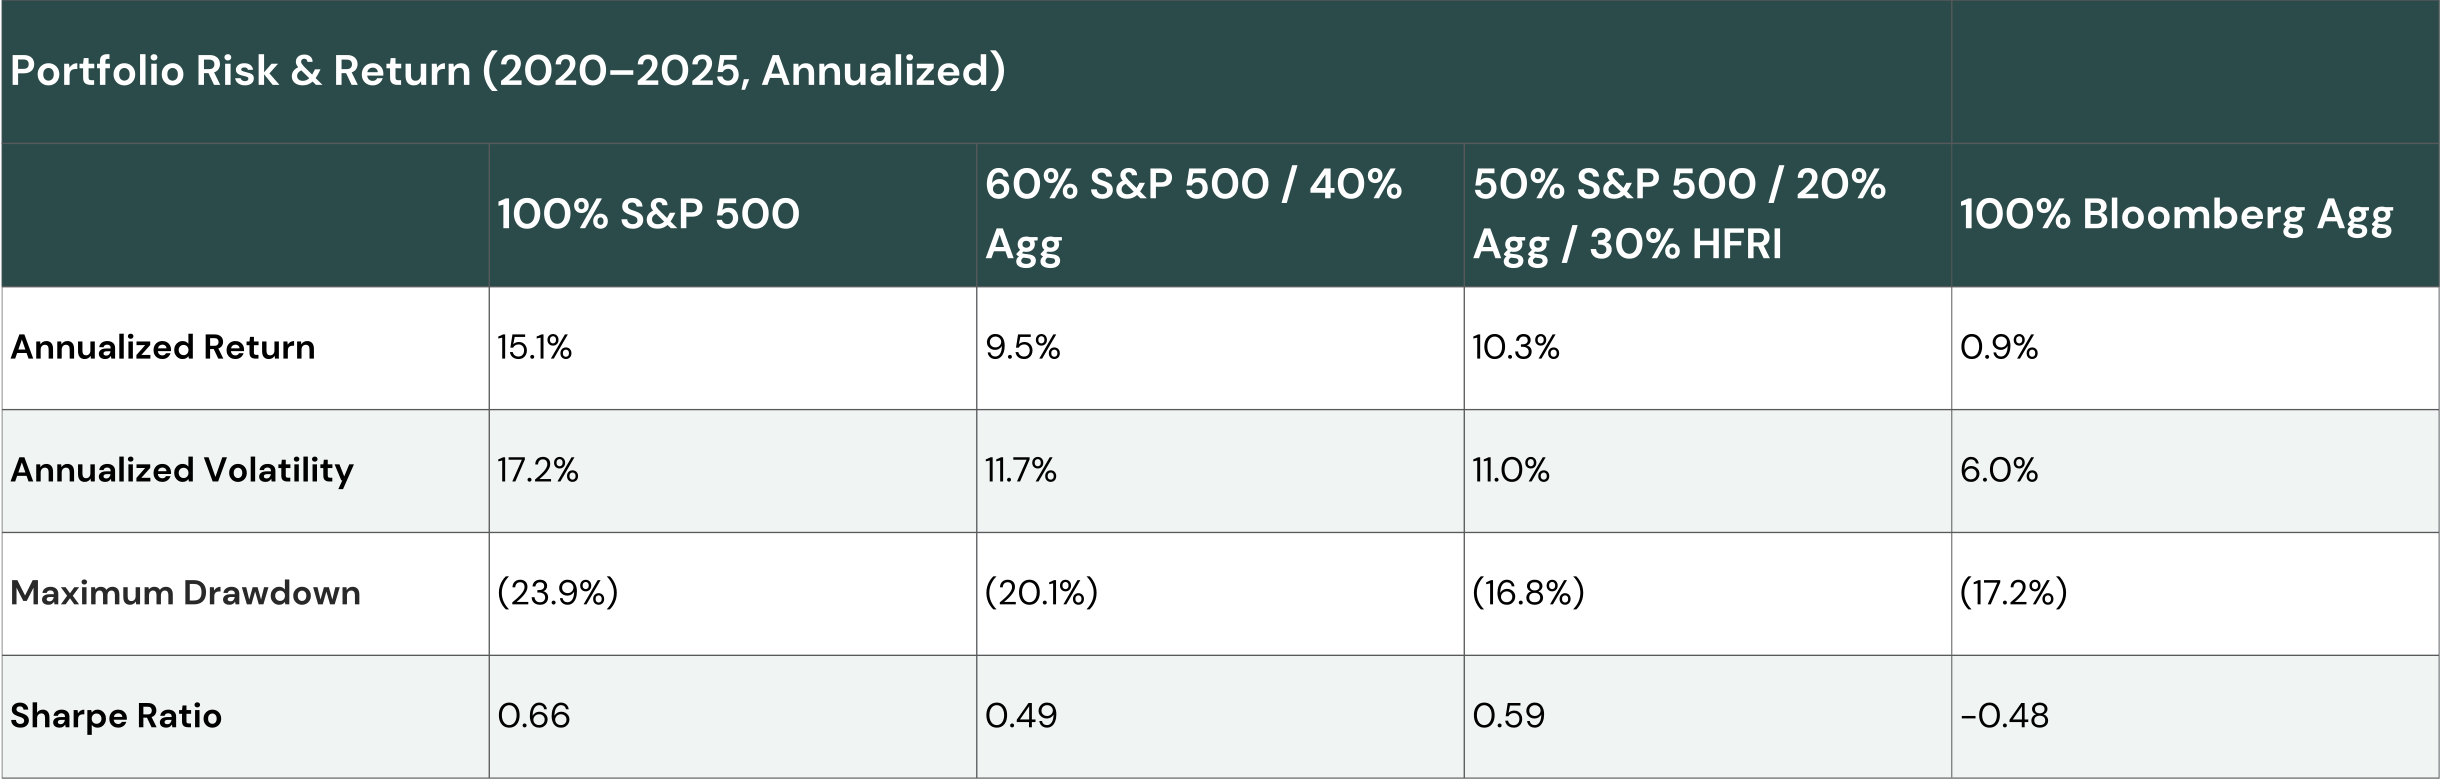
To put this into perspective, we modeled four hypothetical portfolios over the same 2020–2025 period: 100% equities, a traditional 60% equities/40% bonds mix, a portfolio with 50% equities, 20% bonds, and 30% hedge fund exposure represented by the HFRI index, and 100% bonds. Swapping a portion of the bond and equity sleeve for hedge fund exposure lifted the portfolio’s annualized return from 9.5% to 10.3%, trimmed volatility slightly from 11.7% to 11.0%, and cut the maximum drawdown from -20.1% to -16.8%. Sharpe also improves to 0.59, up from 0.49 for the standard 60/40 model, meaning better risk-adjusted performance. Ultimately, when bonds and stocks move together, hedge funds can drive that portfolio diversification.
In addition to hedge funds, real estate and commodities can provide diversification benefits to equities as well, particularly in periods of heightened inflation. Specifically on real estate, rental revenues typically move up with inflation while liabilities are usually fixed, resulting in higher earnings during a period when corporate earnings may be pressured. Asset values for real estate can be more mixed, potentially weakening in the short-term with likely rising interest rates, but tend to grow over the long-term with inflation. In periods of rising inflation, commodities perform well as the demand for raw goods continues to push up prices, similar to the oil rally in 2022 while the rest of the market sold off.
While gold is a precious metal commodity, its inherent value is a bit different in that as it is also considered a store of value and the primary driver of gold prices tends to be correlated to interest rates and currency debasement concerns rather than its physical supply. This can be beneficial as gold maintains a relatively low correlation to equities over longer periods, but tends to be more negative during equity selloffs.
The challenge of adding commodities and gold to portfolios in the current environment is the ongoing Middle East conflict, which has been driving gasoline prices meaningfully this year. However, we see the strategic value of these assets and are slowly introducing them into portfolios. By including these asset classes in alternatives, portfolio resiliency should improve.
Easier Said than Done
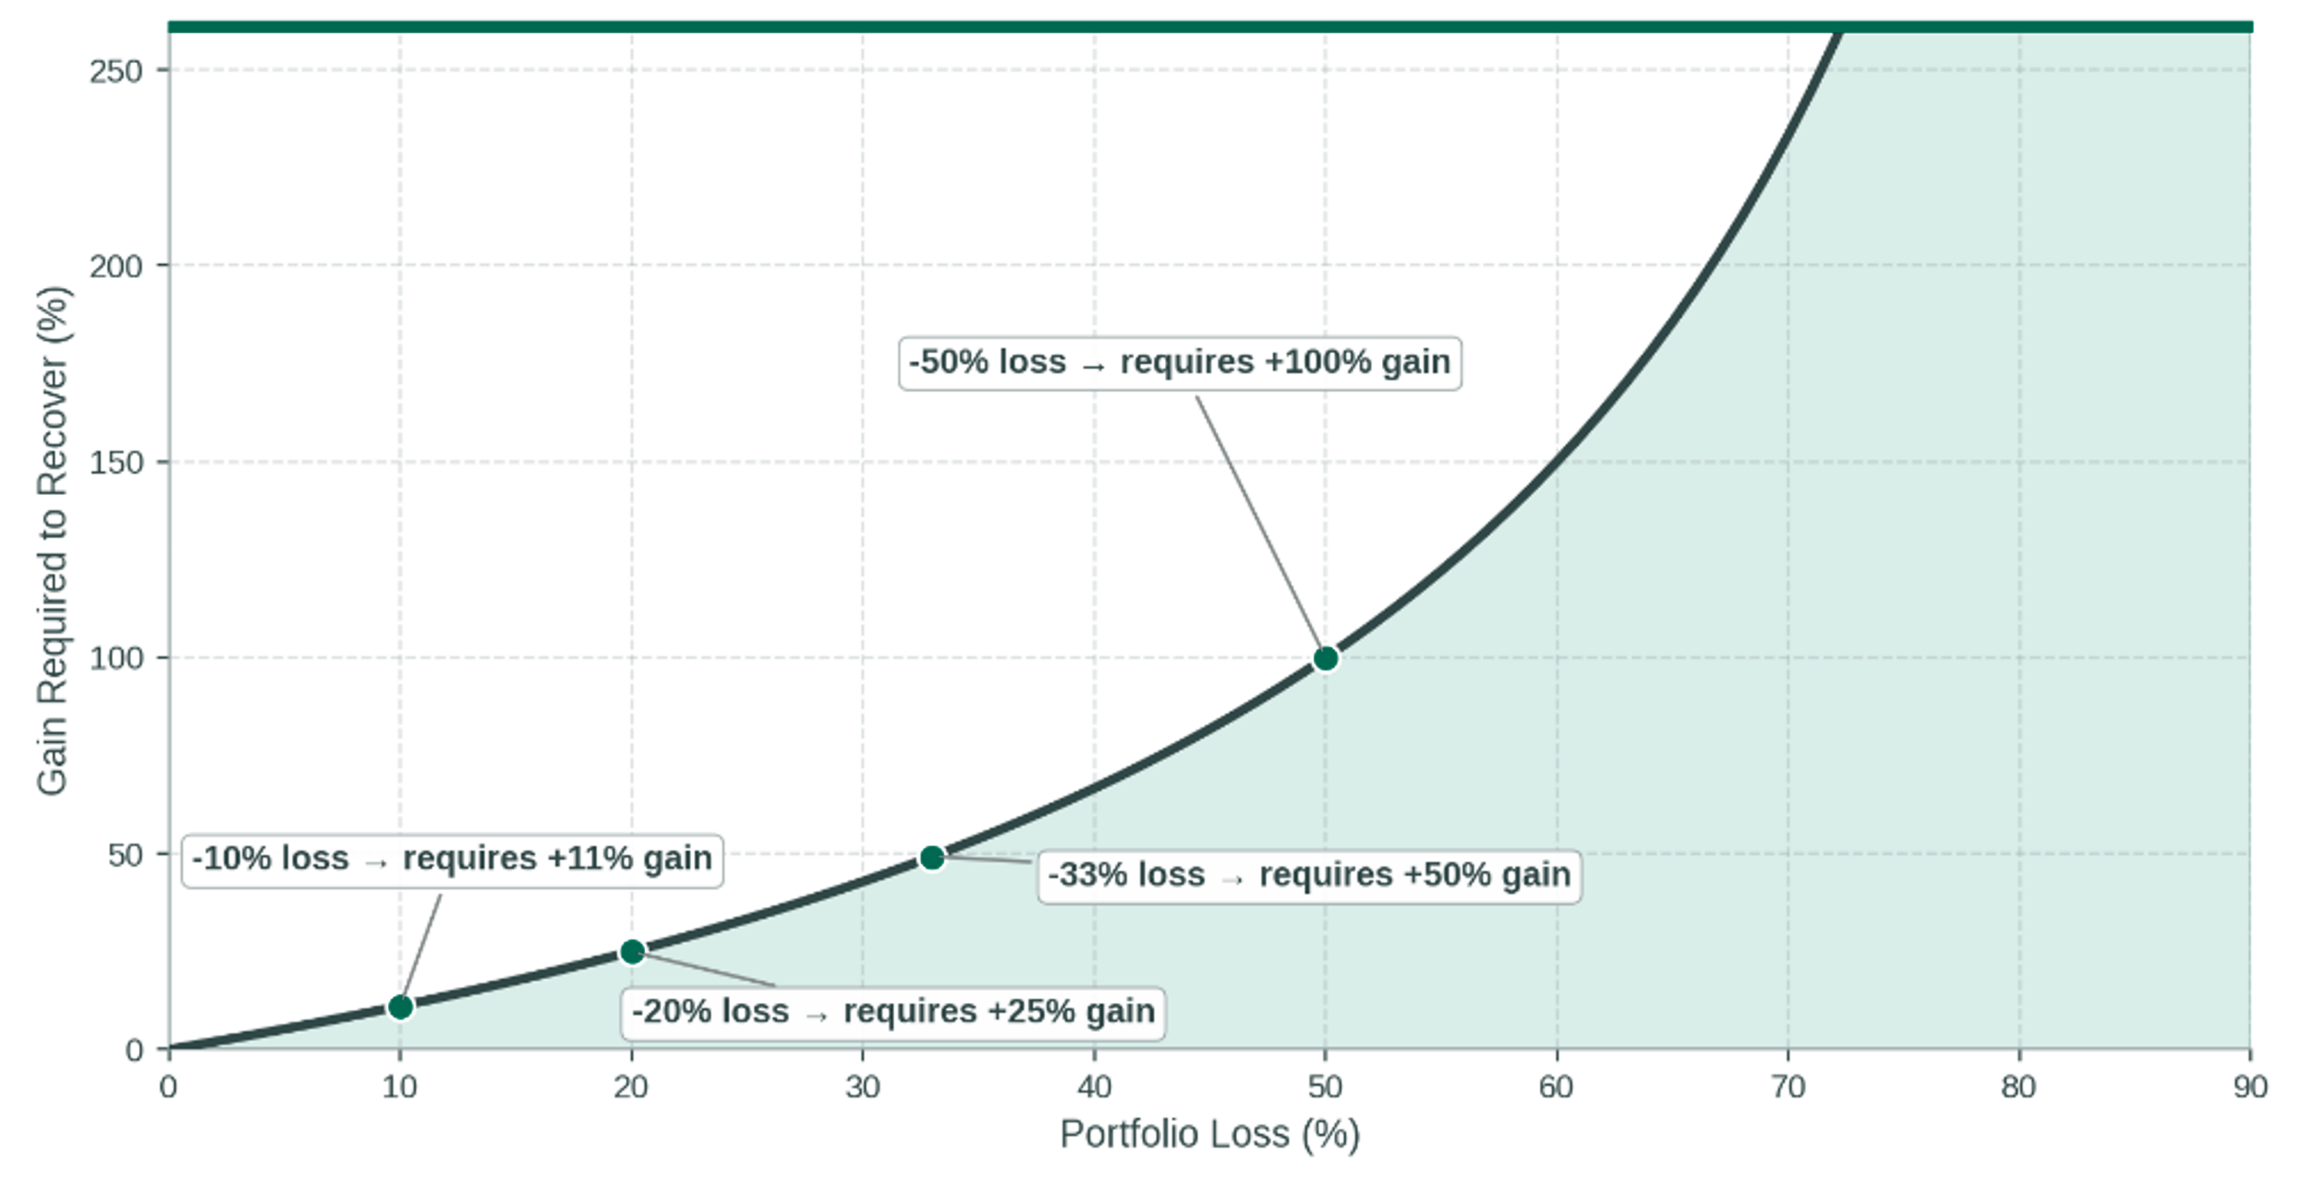
In order to add alternative strategies into portfolios, particularly hedge funds, investors must accommodate less liquidity and higher fees compared to traditional investments. Hedge funds are also typically structured for monthly entries and quarterly exits. Finally, while hedge funds are becoming more fee conscious and tax-sensitive, the vast majority of funds are still considered tax inefficient vehicles, making after-tax returns less compelling if the investment is not held in a tax-exempt or -deferred entity. Given these frictions, we need to ask ourselves whether alternatives are truly worthwhile in a portfolio when put into practice. The primary reason to include alternatives is not to try to outperform equity markets, as equities are already a risky asset class, but rather protecting portfolios in periods of market drawdown and hedge the risk of loss. The larger the amount a portfolio loses, the higher the return must be to recover that loss. For example, if you had $100 and lost $10 in the market, a 10% loss, it would actually require an 11% gain on the remaining $90 to get back to the original $100. If you lost 20%, the portfolio would need to recover 25%. A 50% loss would necessitate the portfolio return 100% in order to break even, a difficult proposition, particularly if time horizons shorten or that remaining principal needs to be spent. If portfolios are built to mitigate the initial loss, the ability to recover and have the potential to do even better increases.
We can also take the view that long-term investors who leave portfolios alone in periods of market stress can perform better simply by owning stocks alone, rather than complicating it with alternatives, if they can stomach the interim volatility and hold their investments through those periods. The case for not needing alternatives is strongest for an investor who truly is indifferent to drawdowns. This would be the purely theoretical infinite-horizon investor with no spending needs and no behavioral risk of bailing out in a crisis. Very few real investors, institutional or individual, actually meet that criterion, and the further you are from that hypothetical investor, the greater the case for alternatives.
While the plan may be to invest for the long-term, investment horizons tend to be shorter than expected on at least portions of the principal due to unanticipated spending needs or changes to the plan. Additionally, long-term horizons eventually become medium-term, then short-term as advisors move through their life stages where principal protection and volatility management become ever more important towards the end of the investment horizon. Having a portfolio for those periods where steady disbursements can be supported by alternative investments can build confidence that the portfolio value will be there in challenging markets. A strategy that can avoid the deepest drawdowns can compound better over time than a higher return strategy that occasionally forces bad behavior at the bottom. We do recognize though that in very good equity markets, portfolios with alternative strategies may lag market moves; however, we would argue this is a modest trade-off for having smaller losses in the more challenging years.
The Math of Drawdowns: Why Avoiding Losses Matters
Source: Simon Quick research
A Word on Private Equity
Private equity is often pitched as a diversifier to public equities, and in some regards that is true, as many businesses and industry segments that private equity sponsors source opportunities from are very different from the composition of public markets. Furthermore, as companies have remained private for longer, we think there is a broad opportunity set to create investment diversification through private investments that complement a public equity portfolio. Private investments tend to benefit from potentially better entry prices and the ability to effectuate change as the controlling owner versus public market investing, which is significantly easier and cheaper to enter and exit, but with less ability to influence management. However, where public and private equity are very similar is that both types of investments typically carry business cycle sensitivity and valuation risks. Additionally, while investors typically do not experience daily market fluctuations in private equity, the two investment types do tend to move together over time as they are influenced by the same broader macro factors. We consider private equity investing as an enhanced equity return strategy: investing in typically smaller businesses with much longer holding periods should produce returns that are meaningfully higher than public stocks over the long-term. While returns can be compelling, private equity investments should be considered a return-enhancing investment rather than a diversifying one.
Asset Class Allocations
Equities – Target Weight
Positive second quarter earnings announcements continue to support the overall strength in business fundamentals of public equities going into year-end. Rising growth expectations have also brought forward P/E multiples down modestly on average, to under 20x. While not cheap, we’re off the highs. As we noted earlier, we do recognize that a dominant driver behind these results and go-forward expectations has been the AI investment theme expanding across industries and thus seek to create some diversification where possible to mitigate repricing risk that may come from weakening investor sentiment. We continue to view large-cap stocks as the appropriate core of a portfolio, given their relative stability and earnings strength. Small cap stocks have performed well this year, but looking forward, we would focus on interest rate resilient cashflow-oriented companies in this segment as a protective measure. We are underweight international equities but maintain an allocation across developed and emerging markets for industry diversification versus what is available in the US alone.
Fixed Income – Target Weight
As we noted in this article, the hedging benefits of fixed income have been muted in this environment of strong growth and high inflation. Thus, we look towards this allocation as a steady income generator and liquidity source that is resilient to changes in interest rates and can be protective through a credit cycle. We aren’t yet reducing our exposure to fixed income, as we tend to undersize the asset class when compared to traditional 60/40 models generally, however we continue to upgrade credit quality and maintain low interest rate sensitivity for now. We do favor securitized credit as a means of collecting incremental interest income, while remaining high quality and curtailing interest rate risk.
Private lending strategies and their structures have come under scrutiny recently. We are long-term constructive on our managers’ ability to weather through a credit cycle. However, given current redemption pressures in the market, we are deploying at a measured pace while we monitor redemptions. Asset-based lending has been largely immune to credit losses and outflows.
Alternatives – Target Weight
Hedge Funds: Hedge funds, specifically uncorrelated strategies, have shown their diversifying benefits to equities this year. We appreciate the consistency of returns without taking much market directional risk. A higher interest rate environment can be beneficial to hedge fund strategies as well. We recently introduced an inflation-aligned commodity/gold strategy to complement our hedge fund allocations.
Real Estate: Income remains stable, and valuations are slowly recovering from higher rates and over-supply. We remain most constructive on Industrial and Residential asset types as defensive assets in the current environment. Income-generating real estate strategies can be an attractive complement to Fixed Income allocations for their tax-advantaged distributions. We are once again exploring opportunity zone funds as updated regulations have made the program perpetual and an attractive tool for tax management of large gains.
Private Equity: We remain constructive on private equity as fundamentals are improving and capital markets are stable. Private-market valuations have lagged the rally seen in public markets, particularly in the lower middle market space, leaving the opportunity to catch up as we look forward. The reopening IPO window is restoring the exit channel that had been the missing piece for several years and should improve distributions from funds. We continue to favor buy-out strategies and are selectively investing in venture and late-stage growth funds in this period.
We are approaching our third close of the Simon Quick Private Equity fund and are actively deploying into lower middle market buyout, venture, and opportunistic strategies through 2027.
Important Disclosures
This information is for general and educational purposes only. You should not assume that any discussion or information contained herein serves as the receipt of, or as a substitute for, personalized investment advice from Simon Quick Advisors & Co., LLC (“Simon Quick”) nor should this be construed as an offer to sell or the solicitation of an offer to purchase an interest in a security or separate accounts of any type. Asset Allocation and diversifying asset classes may be used in an effort to manage risk and enhance returns. It does not, however, guarantee a profit or protect against loss. Investing in Liquid and Illiquid Alternative Investments may not be suitable for all investors and involves a high degree of risk. Many Alternative Investments are highly illiquid, meaning that you may not be able to sell your investment when you wish. Risk of Alternative Investments can vary based on the underlying strategies used.
Please remember that past performance may not be indicative of future results. Different types of investments involve varying degrees of risk, and there can be no assurance that the future performance of any specific investment, investment strategy, or product (including the investments and/or investment strategies recommended or undertaken by Simon Quick), or any non-investment related content, made reference to directly or indirectly in this newsletter will be profitable, equal any corresponding indicated historical performance level(s), be suitable for your portfolio or individual situation, or prove successful. Due to various factors, including changing market conditions and/or applicable laws, the content may no longer be reflective of current opinions or positions. To the extent that a reader has any questions regarding the applicability of any specific issue discussed above to his/her individual situation, he/she is encouraged to consult with the professional advisor of his/her choosing. Simon Quick is neither a law firm nor a certified public accounting firm and no portion of the newsletter content should be construed as legal or accounting advice. If you are a Simon Quick client, please remember to contact Simon Quick, in writing, if there are any changes in your personal/financial situation or investment objectives for the purpose of reviewing/evaluating/revising our previous recommendations and/or services.
Simon Quick Advisors, LLC (Simon Quick) is an SEC registered investment adviser with a principal place of business in Morristown, NJ. Simon Quick may only transact business in states in which it is registered, or qualifies for an exemption or exclusion from registration requirements. A copy of our written disclosure brochure discussing our advisory services and fees is available upon request. References to Simon Quick Advisors as being “registered” does not imply a certain level of education or expertise.
This newsletter and the accompanying discussion include forward-looking statements. All statements that are not historical facts are forward-looking statements, including any statements that relate to future market conditions, results, operations, strategies or other future conditions or developments and any statements regarding objectives, opportunities, positioning or prospects. Forward-looking statements are necessarily based upon speculation, expectations, estimates and assumptions that are inherently unreliable and subject to significant business, economic and competitive uncertainties and contingencies. Forward-looking statements are not a promise or guaranty about future events.
Economic, index, and performance information herein has been obtained from various third-party sources. While we believe the source to be accurate and reliable, Simon Quick has not independently verified the accuracy of the information. In addition, Simon Quick makes no representations or warranties with respect to the accuracy, reliability, or utility of information obtained from third parties.
Historical performance results for investment indices and/or categories have been provided for general comparison purposes only, and generally do not reflect the deduction of transaction and/or custodial charges, the deduction of an investment management fee, nor the impact of taxes, the incurrence of which would have the effect of decreasing historical performance results. It should not be assumed that your account holdings correspond directly to any comparative indices or benchmark index, as comparative indices or benchmark index may be more or less volatile than your account holdings. You cannot invest directly in an index.
Indices included in this report are for purposes of comparing your returns to the returns on a broad-based index of securities most comparable to the types of securities held in your account(s). Although your account(s) invest in securities that are generally similar in type to the related indices, the particular issuers, industry segments, geographic regions, and weighting of investments in your account do not necessarily track the index. The indices assume reinvestment of dividends and do not reflect deduction of any fees or expenses.
Please note: Indices are frequently updated and the returns on any given day may differ from those presented in this document. Index data and other information contained herein is supplied from various sources and is believed to be accurate but Simon Quick has not independently verified the accuracy of this information.