
Heading off to (Electoral) College
Before entering the field of finance, I initially had aspirations of building a career as a diplomat that culminated as an ambassador to a major nation, if I couldn’t become the Secretary of State. I majored in International Relations in college, had completed an internship in Washington D.C., and was preparing to take the foreign service exam. However, after a pivotal conversation with one of my professors, I realized that I didn’t have the mental fortitude nor pain threshold to make it into the CIA and become a spy, which was supposed to be the first step in my journey. Nonetheless, I continue to appreciate what I learned from my political science classes, particularly as we watch the 59th Presidential election for our country unfold in the coming weeks. We aren’t bold enough to make any predictions as to who will win the Presidency or which party will control the Senate. However, we consider the potential outcomes of elections and possible impacts they may have on the economy, capital markets and our investments.
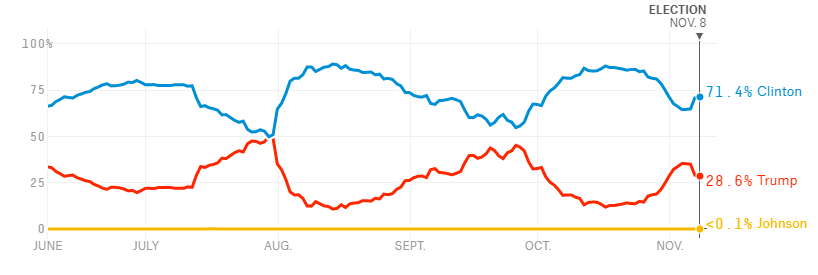
November 4th, or later
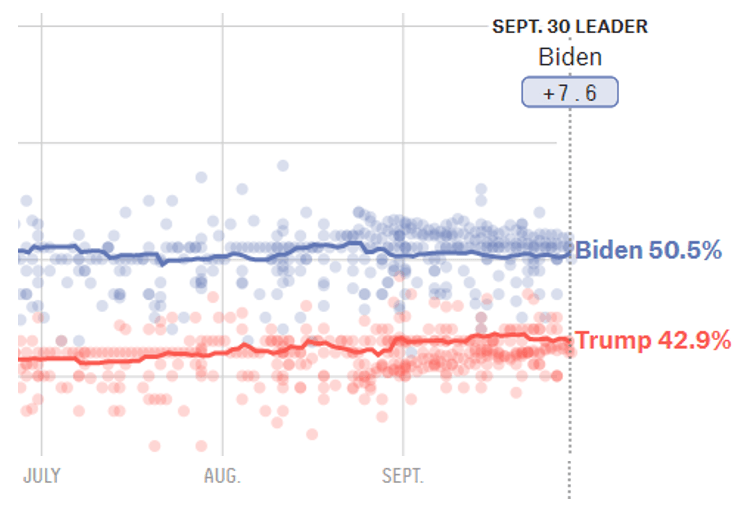
I woke up a little before 2am on November 9th four years ago, checked the election results and wondered if I was still dreaming for a few minutes, before getting out of bed to get an early start in the new world order. Regardless of one’s political allegiances, the results were a shocker. Hillary Clinton was holding a decisive lead heading into the polls, yet ultimately lost. Today, looking at a rough 8-point Biden lead seems like the equivalent of a dead heat between the candidates. History has shown that incumbent Presidents with approval ratings in the low- to mid- 40s, where President Trump is currently tracking, do not fare well in winning a re-election. However, an incumbent candidate typically has a higher probability of winning re-election, which would then favor Trump. We will call it a coin-flip for now. We do recognize a contested result may push clarity as to who will be in the White House into December, and in the interim introduce further market volatility.
Election Probabilities in 2016 and Today
Source: FiveThirtyEight
Not everything rides on the Presidential election, though. The federal government is comprised of the Executive (President), Legislative (Congress), and Judicial (Supreme Court) branches, with varying powers divided amongst them. While the Presidential seat is very important and deserves all the attention it receives, its power is constrained to a degree by the legislation passed through the House of Representatives and the Senate, that make up the US Congress. What spurred markets higher on November 9, 2016 was not only that Republican Presidential candidate, Donald Trump, won the White House, but Congress was retaining a Republican majority in both chambers. Trump’s platform, headlined with tax cuts, could swiftly be ushered into law through Congress.
This year’s elections will be significant as there is a possibility for Democrats regaining the Senate majority and potentially sweeping the White House and Congress. All 435 seats in the House of Representatives are up for election every two years. In 2018, the House flipped to a Democratic majority, while Republicans retained control of the Senate. This has slowed the enactment of new laws, but certain influential powers reside with the Senate, such as confirming Supreme Court Justice appointments. While all seats are up for election, pundits would characterize only about fifty of them as competitive elections, with the remainder already skewed in favor of one party or the other. Republicans would need to win 38 of those 50 seats in order to take the majority. If we consider the current split along party lines, the Republicans would need to flip 21 seats in order to become the new majority. While this is not impossible, it is difficult, and thus the consensus view is that the House will remain in Democratic control.
It’s a closer race for the Senate, as there are 35 seats up for election, 23 of which are currently Republican. Ten of those seats are considered competitive races, while only two of the 12 Democratic seats are. Democrats need to flip four seats to become the new Senate majority, a plausible outcome and the path for the legislative branch being in Democratic control, even if Trump were to be re-elected.
Odds for Senate Majority (Dems-Blue/Reps-Red)
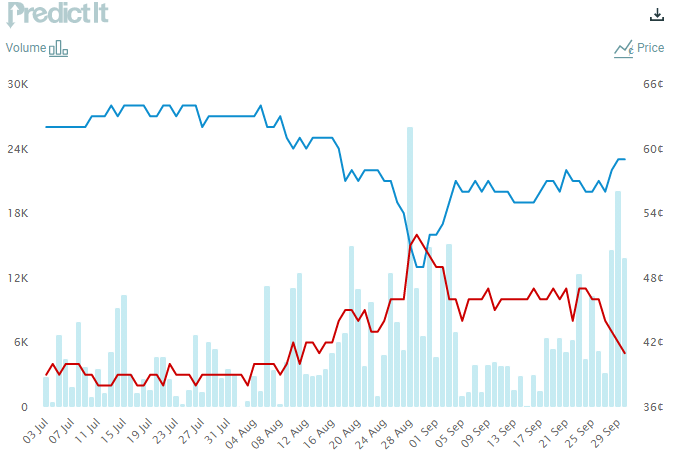
Source: PredictIt
Economic Impact
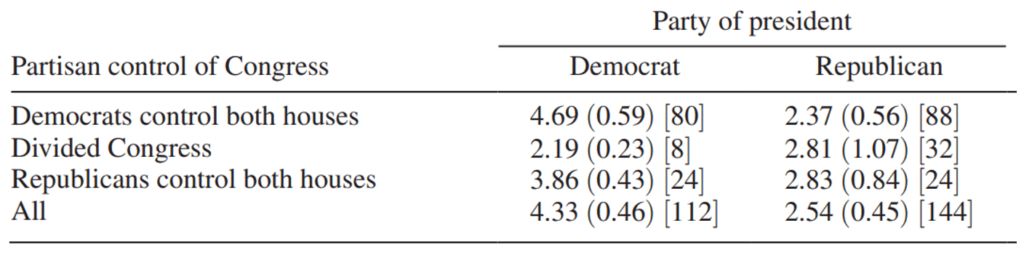
Before considering the potential impact of the 2020 elections, let’s review the historical experience of economic cycles and market performance under different party leadership. Princeton University professors Alan S. Blinder and Mark W. Watson investigated economic performance under various administrations since World War II. While their findings are somewhat dated in that it doesn’t include data from Obama’s second term and Trump’s first, the 64-years of information that it has observed show that US GDP grew at an average pace of 4.3% per year under a Democratic President. In contrast, Republican Presidents delivered a 2.5% average annual expansion, peppered with longer periods of recession.
Economic Expansion under Democratic and Republican Presidents
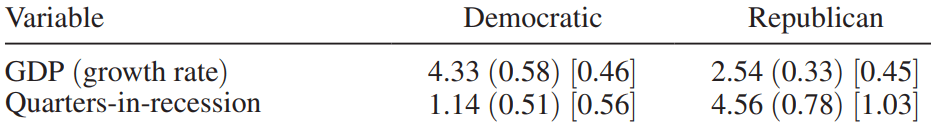
Source: Blinder & Watson: Presidents and the US Economy
We would not put too much emphasis on this correlation and find it to be more coincidental than causation. However, we find it interesting that despite the “pro-business” reputation of the party, Republican Presidents haven’t empirically delivered on stronger economic expansion. Amusingly, Donald Trump had felt the same way before his first run for President, commenting that, “It just seems that the economy does better under the Democrats than the Republicans. Now, it shouldn’t be that way. But if you go back, I mean it just seems that the economy does better under the Democrats,” in a 2004 CNN interview.
To be fair, the President doesn’t control the government, as we mentioned earlier, rather he shares in that responsibility with the legislature. History also shows that Republican Presidencies with a divided Congress have experienced greater expansion than under Democratic Presidents. Thus, our conclusion is that party affiliations of the President may not matter much for the economy.
Economic Expansion under Presidents and Various Congressional Control
Source: Blinder & Watson: Presidents and the US Economy
Market Impact
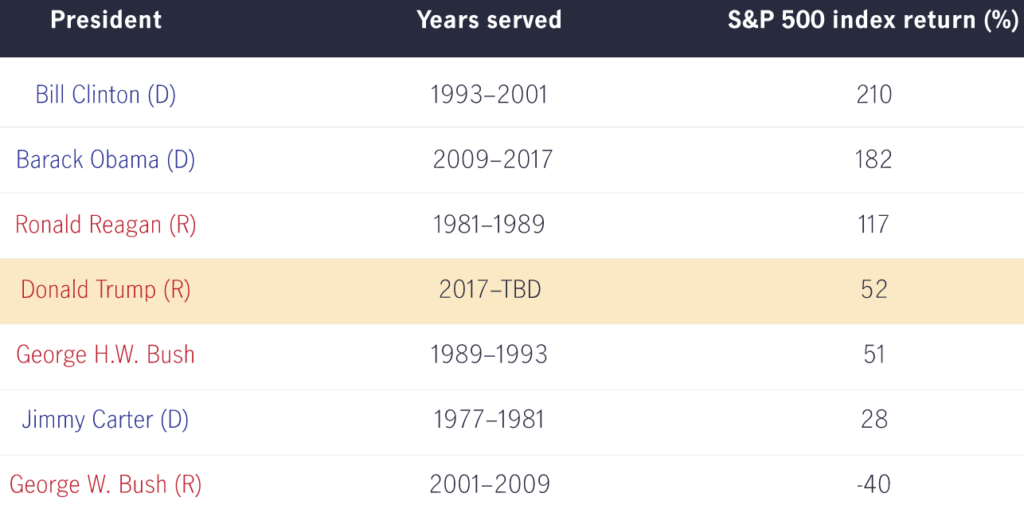
Almost exactly a year ago, we wrote about how the stock market and economy do not move in unison. At best, they’re awkward dance partners that try to sway to the same rhythm, but with many missteps along the way. So, while it’s interesting to consider that a Democratic President may be a benign factor to the economy, market performance, specifically for stocks, is driven more by investor sentiment than government policy, at least over short periods. But even by this measure, it appears that the stock market performs better under Democratic Presidents as well. Similar to the earlier historical review of economic expansion under the two political parties, data seems to point to an almost 9% return on the Dow Jones Industrials Average Index since 1900 under a Democratic President, and almost 6% under a Republican one. The outperformance is similar when looking at the relatively younger S&P 500 index. Thus, one should not put undue reliance on the President’s party affiliation in making investment decisions.
Source: John Hancock Investments
Thus far, we’ve stated our case that investment portfolios aren’t at any greater risk of loss between a Democratic or Republican President. In fact, long-term investors really don’t have to fret over the impact of any single Presidential term on their portfolios. Since 1990, the S&P has annualized at about 10% returns over a trailing 4-year period. The range of returns over four years is between -10% and +31% during that period, with about 78% of all observations being positive. Over eight years, less than 5% of observations are negative. Despite this data, we’re currently seeing a similar phenomenon where markets sold off beginning in September as the Democratic party began to gain momentum. We recognize that Biden’s platform for raising taxes as well as an increase in regulation on large corporations may seem to be the potential driver for both economic and market malaise, but this may be short-sighted when considering the broader stimulative plans that may mitigate, if not offset, the losses from higher taxes. Investor de-risking from the fear of change, rather than the actual change, can be an opportunity for generating investment returns if history repeats itself. “Taking chips off the table” for fear of the November elections, may provide mental peace of mind, but can introduce another risk into portfolios, which is missing out on potential upside if policy action is delayed or watered down. A Democratic Presidency does not throw a cold towel on a hot market and a consistent long-term investment program is more successful and resilient to any single Presidential term.
Biden’s Impact
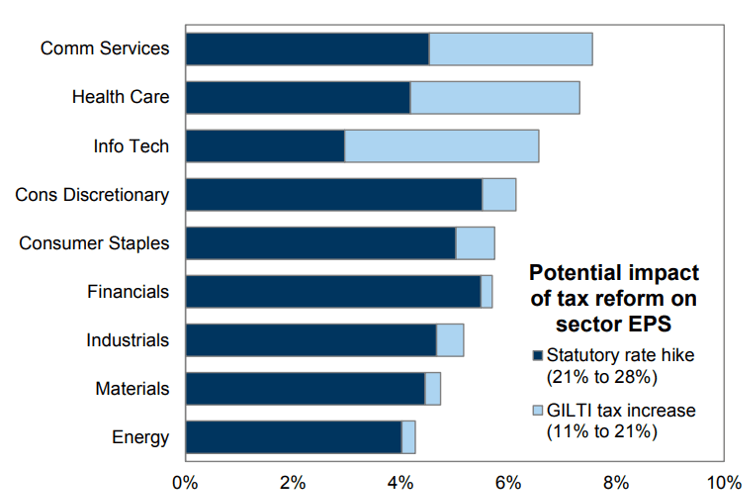
While the long-term outlook for stocks remain positive, regardless of which candidate controls the West Wing, there will be notable near-term effects to investors and certain sectors of the economy if Biden were to win. The most significant would be a roll-back of Trump’s $2 trillion tax cut program that came from the Tax Cuts and Jobs Act in 2017. This would impact wealthy individuals earning more than $1 million per year, who would see long-term capital gains tax nearly double to 39.6%, from the current 20% level. This is weighing on investor sentiment as those looking to realize gains would rather do so in 2020 at half the rate than wait and pay more. Businesses would also be impacted with a potential income tax hike to 28%, from the current 21% level. The negative result of these specific actions could cut about 9% of earnings from the S&P500 next year, according to Goldman Sachs. Additional taxes on foreign income would further impact more globally exposed industries, which would particularly hit earnings of the high-flying Technology and Communication Services sectors, in addition to Healthcare.
Source: Goldman Sachs
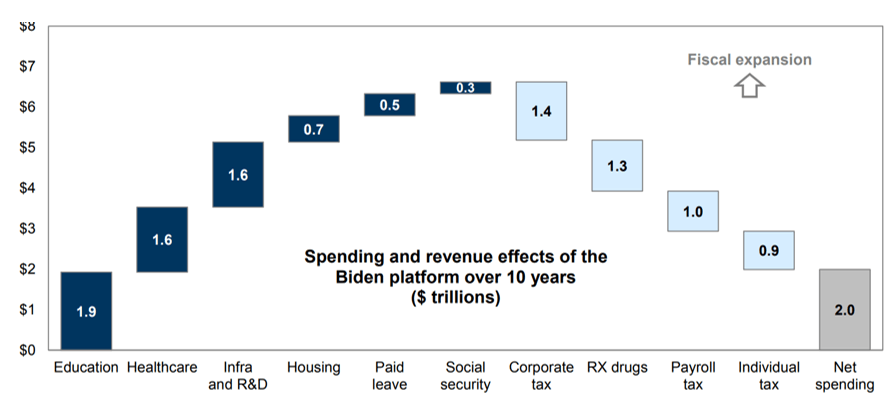
With new tax revenue, the Biden administration would be looking to allocate these funds towards a large stimulus program to reinvigorate the economy from the effects of COVID-19. While this may be long-term inflationary, it could be positive for economic growth and dampen some of the earnings loss from taxes. Goldman Sachs estimates that Biden’s spending plan would be a gross of $7 trillion over ten years and allocated towards infrastructure, education, clean energy, and healthcare.
Source: Goldman Sachs
We recognize that this plan may drive a rotation away from large cap and growth stocks and into cyclical sectors. While this may have short-term negative effects on valuations for Tech and Tech-enabled businesses, fundamentals should continue to remain strong in this sector, if not further accelerate alongside the economy and support the long-term investment opportunity in the space. Innovation and accelerating market adoption should continue to be a long-term tailwind for secular growth of the industry.
The healthcare sector may be impacted by Biden’s policies similar to what we saw with the enactment of Obamacare (Affordable Care Act) in 2010. Under Biden, the program should continue to receive support and possibly expand, particuarly around drug pricing controls, which may impact profitability. Because of these risks, the sector has been trading at a discount to the broad index at 15.1x Forward P/E versus the S&P500 at 20.9x, second-cheapest in the index after Financials. We find this to be an attractive entry opportunity as the market seems to be pricing in a lot of the downside risks already for a consistently growing, defensive industry.
We won’t review the potential impact of a Biden presidency across all sectors here, however note that Energy and Financials may be losers as the candidate has pushed for expansion of alternative energy while limiting new drilling, and increased financial services scrutiny. If Elizabeth Warren obtains a Cabinet seat under Biden, pressure on banking and consumer finance regulations and capital management will likely step-up. We note that the mega-cap Tech and media companies may come under greater anti-competition and regulatory scrutiny as well, and thus we have focused portfolios towards relatively smaller companies with strong growth prospects across a variety of industries.
We had favored domestic equities over international stocks for some time now. International economies and stock performance has generally lagged the US, and dollar strength amidst escalating trade tensions more than offset the benefit of lower valuations abroad. However, a Biden administration may start to support foreign stocks as domestic inflation, from fiscal stimulus, would weaken the dollar in their favor. Easing trade tensions will also likely stimulate trade and foreign stock profitability.
Asset Allocation
Equities: Target-Weight
The reopening of cities, businesses adapting, and life continuing to move forward in this new COVID-aware paradigm has supported the markets turning positive on the year. While further economic recovery will remain choppy, monetary and fiscal support should serve as a safety net to markets. Stock performance has still been relatively narrow, thus we continue to find sector-based and discrete opportunities outside mega-cap Tech names to drive returns, albeit on relatively higher valuations.
We anticipate equities to be more skittish as we approach the elections, thus remain staunchly focused on quality businesses that show stable earnings and cash flow growth, rather than lean into more cyclical companies that are reliant on a continued sharp recovery. Technology as a long-term theme, and companies that adapt and innovate their businesses to utilize it, continues to be an area of focus, as it is mission-critical for them if they wish to stay relevant with their customers and continue to grow. We remain underweight “Value” stocks, specifically in cyclical sectors, as well as smaller cap companies that lack the robustness of balance sheet and revenue generation. We have added Healthcare exposure given its defensive characteristics and relatively low valuations. We remain underweight international exposures, but have modestly increased our developed and emerging market positions to benefit from the weaker dollar and diversified economic recovery.
Fixed Income: Underweight
Low absolute yields and heightened inflationary risks in Fixed income have caused us to rotate away from this asset class and into Alternatives. Within our underweight recommendation, we are positioned in investment grade and cross-over credit risk and in structured credit opportunities. The risk of higher taxes has increased our focus on tax-exempt opportunities.
Liquid Alternatives: Overweight
We remain constructive on hedge funds in the current environment as managers can take a more targeted approach towards investments on both longs and shorts in a still relatively higher volatility environment. Arbitrage strategies have seen an expansion in spreads, which should result in better returns overall, without taking greater directional risk. In equities, we remain convicted in our systematic and sector-focused funds. Structured and distressed credit strategies remain a significant area of focus, given the expanded opportunity set for managers to participate in through the recovery.
Illiquid Alternatives: Overweight
We remain overweight illiquid alternatives given their longer investment periods and ability to extract value through active engagement with their portfolio companies. In the short-term, an economic recession will impact private businesses along with their public peers. However, the control held by our managers in executing on operational change and revenue growth can drive true fundamental value creation during the long-term holding periods. Additionally, valuations are driven less by technical factors exhibited in public markets, as the majority of investors plan to hold positions over multiple years, rather than looking for a short-term gain. We recognize that cyclically sensitive businesses will be the most impacted during this time, but this can also create opportunity for funds currently raising capital to deploy into. Private equity funds will likely experience two to three presidential elections through their fund life, and thus should be considered based on the long-term strategy’s fundamental merits, rather than the current political tone. Over an investment cycle, private equity investments should generate materially stronger returns over public markets in exchange for longer holding periods. We are recommending allocations to innovative credit lending, middle-market buy-out, and venture opportunities today. We currently find venture capital opportunities particularly compelling, as corporations are buying innovation to remain competitive and consumers are accelerating their adoption of seamless digital transactions, virtual communication, and augmented experiences in the current “socially distant” environment. These factors support significant long-term upside opportunities with experienced entrepreneurs.
Do you have any questions regarding this content? We would love to chat!
Important Disclosures
This information is for general and educational purposes only. You should not assume that any discussion or information contained herein serves as the receipt of, or as a substitute for, personalized investment advice from Simon Quick Advisors & Co., LLC (“Simon Quick”) nor should this be construed as an offer to sell or the solicitation of an offer to purchase an interest in a security or separate accounts of any type. Asset Allocation and diversifying asset classes may be used in an effort to manage risk and enhance returns. It does not, however, guarantee a profit or protect against loss. Investing in Liquid and Illiquid Alternative Investments may not be suitable for all investors and involves a high degree of risk. Many Alternative Investments are highly illiquid, meaning that you may not be able to sell your investment when you wish. Risk of Alternative Investments can vary based on the underlying strategies used.
Please remember that past performance may not be indicative of future results. Different types of investments involve varying degrees of risk, and there can be no assurance that the future performance of any specific investment, investment strategy, or product (including the investments and/or investment strategies recommended or undertaken by Simon Quick), or any non-investment related content, made reference to directly or indirectly in this newsletter will be profitable, equal any corresponding indicated historical performance level(s), be suitable for your portfolio or individual situation, or prove successful. Due to various factors, including changing market conditions and/or applicable laws, the content may no longer be reflective of current opinions or positions. To the extent that a reader has any questions regarding the applicability of any specific issue discussed above to his/her individual situation, he/she is encouraged to consult with the professional advisor of his/her choosing. Simon Quick is neither a law firm nor a certified public accounting firm and no portion of the newsletter content should be construed as legal or accounting advice. If you are a Simon Quick client, please remember to contact Simon Quick, in writing, if there are any changes in your personal/financial situation or investment objectives for the purpose of reviewing/evaluating/revising our previous recommendations and/or services. Simon Quick Advisors, LLC (Simon Quick) is an SEC registered investment adviser with a principal place of business in Morristown, NJ. Simon Quick may only transact business in states in which it is registered, or qualifies for an exemption or exclusion from registration requirements. A copy of our written disclosure brochure discussing our advisory services and fees is available upon request. References to Simon Quick as being “registered” does not imply a certain level of education or expertise.
This newsletter and the accompanying discussion include forward-looking statements. All statements that are not historical facts are forward-looking statements, including any statements that relate to future market conditions, results, operations, strategies or other future conditions or developments and any statements regarding objectives, opportunities, positioning or prospects. Forward-looking statements are necessarily based upon speculation, expectations, estimates and assumptions that are inherently unreliable and subject to significant business, economic and competitive uncertainties and contingencies. Forward-looking statements are not a promise or guaranty about future events.
Economic, index, and performance information herein has been obtained from various third party sources. While we believe the source to be accurate and reliable, Simon Quick has not independently verified the accuracy of information. In addition, Simon Quick makes no representations or warranties with respect to the accuracy, reliability, or utility of information obtained from third parties.
Historical performance results for investment indices and/or categories have been provided for general comparison purposes only, and generally do not reflect the deduction of transaction and/or custodial charges, the deduction of an investment management fee, nor the impact of taxes, the incurrence of which would have the effect of decreasing historical performance results. It should not be assumed that your account holdings correspond directly to any comparative indices or benchmark index, as comparative indices or benchmark index may be more or less volatile than your account holdings. You cannot invest directly in an index.
Indices included in this report are for purposes of comparing your returns to the returns on a broad-based index of securities most comparable to the types of securities held in your account(s). Although your account(s) invest in securities that are generally similar in type to the related indices, the particular issuers, industry segments, geographic regions, and weighting of investments in your account do not necessarily track the index. The indices assume reinvestment of dividends and do not reflect deduction of any fees or expenses.
Please note: Indices are frequently updated and the returns on any given day may differ from those presented in this document. Index data and other information contained herein is supplied from various sources and is believed to be accurate but Simon Quick has not independently verified the accuracy of this information.