
There is a large and growing ecosystem of secondaries transactions in private markets. Secondaries transactions are the engine that drives capital market activity. For example, most people are familiar with buying stocks on a public exchange whereby they buy them from a previous owner. Buyers and sellers meet to establish a price where both parties are satisfied with the exchange and allow for money to flow across governments, banks, institutions, and individuals. These transactions are efficient, transparent, and straightforward.
There are $12T invested in private markets with more than half of that sum in the US1. While this is only a fraction of the $230T in US public equities and fixed income markets, it is still a significant amount2. On the other hand, private market investments such as buyout, venture capital, real estate, and private credit offer investors higher return potential in exchange for longer holding periods and limited liquidity. Secondaries have created an opportunity for when those expectations have changed, and liquidity is needed sooner rather than later. It has also created an attractive return opportunity for buyers and provides liquidity to sellers.
The secondaries market stemmed from a need for liquidity in an illiquid market. The predominant driver of secondaries transactions in the private market is Limited Partners (LP) needing liquidity prior to their investment term ending. Private market secondaries transactions started to gain traction after the global financial crisis (GFC), creating liquidity in a previously illiquid market. Secondaries come in a few forms but can be classified into two main categories: LP-led and General Partner (GP)-led and can include individual investments or pooled fund vehicles.
LP-led secondaries exist when an LP, in a private investment, seeks liquidity prior to the end of the investment life and a buyer purchases that LP’s interest, typically at a discount to current value. There may be nothing inherently wrong with the investment, but the holder may value liquidity more than the discount taken on the asset to affect the transaction.
There are a few different flavors of GP-led secondaries with the most common being continuation vehicles (CVs). This is where the GP of the fund aims to launch a new vehicle with the purpose of giving one or more of its investments additional time to reach performance expectations; 80%-85% of GP-led transactions from 2022 and 1H 2023 were CVs3.
Secondaries should be viewed as their own asset class within private market investments. They provide four key benefits that other private strategies lack, such as 1) a mitigated (or no) J-curve, which is the multi-year period at the start of a private investment where there is negative performance because there is no appreciation in the underlying investments. 2) Secondary investments provide limited- to – no blind-pool risk as the investments being made are known, 3) a shorter term and faster liquidity as the portfolio is already seasoned, and 4) lower risk stemming from the previously mentioned benefits coupled with higher diversification leading to less individual company risk. Secondaries funds return capital back to LPs faster with typically lower risk, making them an ideal allocation in a balanced portfolio. They limit the typical drawbacks of most private market investments such as longer duration, blind pool risk, and the j-curve. While these are de-risked transactions, they are still strong absolute performers.
Through 2022, secondaries have delivered stronger horizon IRRs than the S&P 500 over 20 years. Relative to the broader private capital market, secondaries also outperformed other asset classes. As shown in the below chart, secondaries have outperformed private capital across all holding periods except on a 10-year horizon basis which was driven by strength in venture capital markets buoying the market.

Source: PitchBook | Geography: North America | Data as of December 31, 2022. Note: all public index values are total return CAGRs.
As we mentioned earlier, the GFC catalyzed the growth of secondaries transactions meaningfully. In 2003, the transaction volume was $5B which skyrocketed to $20B in 20084. Secondaries peaked in 2021 at $132B in transaction volume4. GP-led secondaries came to the market in 2012 at $2B out of the $25B of secondaries transaction volume in that year and has marched upwards 48% of overall secondaries volume in 20224. The need to monetize investments spurred the GP-led secondaries trend and has continued to gain momentum as they provide innovative solutions in muted public and M&A exit environments. Sponsors have adopted the various types of GP-led secondaries as a viable and attractive exit path in all market conditions led by engaged investors looking for high-quality assets.
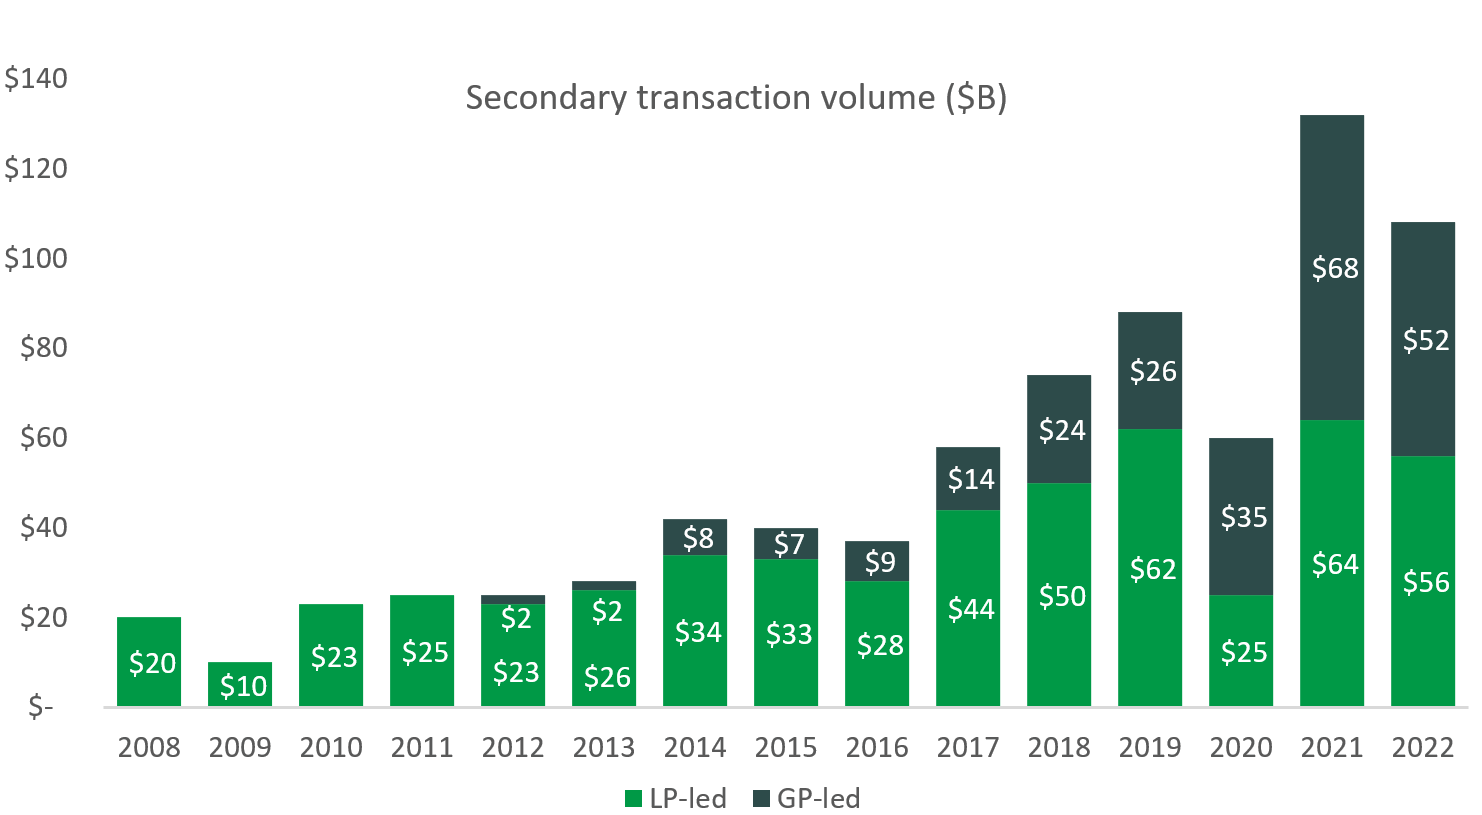
Source: PitchBook, Jefferies.
While secondaries have continued to gain traction, they are still one of the smallest asset classes in private markets averaging only 4% of annual capital raised since 20085 (ahead of only real assets and fund of funds). The growth is there though, as GPs are actively moving into the space with a peak of 117 funds raised in 2021, up from 35 in 20086.
Fear of an economic slowdown, the rapid interest rate increases, and the Russo-Ukrainian War, drove the market selloff in 2022. Weak public markets led private market valuations lower, from their peaks in 2021, creating uncertainty as to where they would bottom. This created a dearth of deal flow and asset sales via traditional exit paths. Private equity valuations reached an 8-year low of 10.5x EV/EBITDA multiples from a peak of 12.4x in 2020, and venture capital valuations, (except for seed-stage) are still well under water7. Exit opportunities became limited and, as a result, 2022 was the slowest VC-back IPO market since the GFC with only 39 IPOs7.
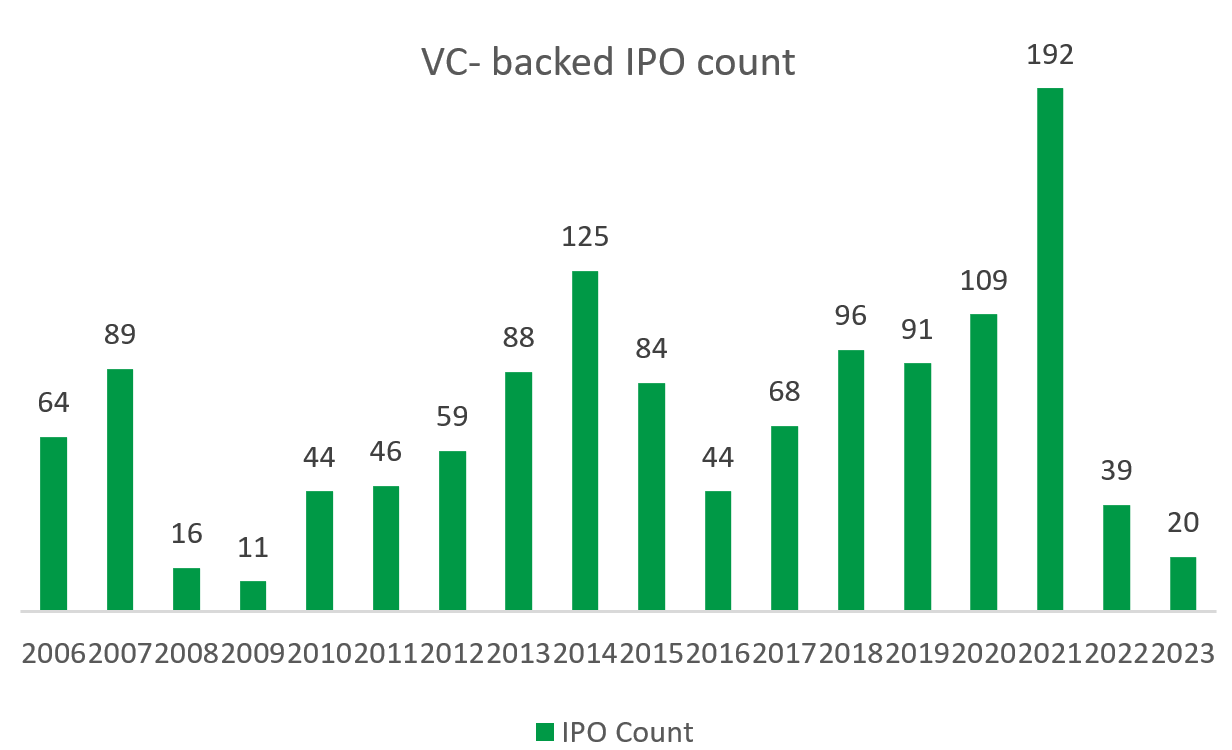
Source: PitchBook, Analyzing the IPO Market Outlook.
In buyout, exit count and value remain below pre-COVID-19 averages and 2023 is a continuation of the halted exits experienced in 2022. There is a need from both LPs and GPs to drive monetizations and provide liquidity and secondaries present an alternative option for liquidity.
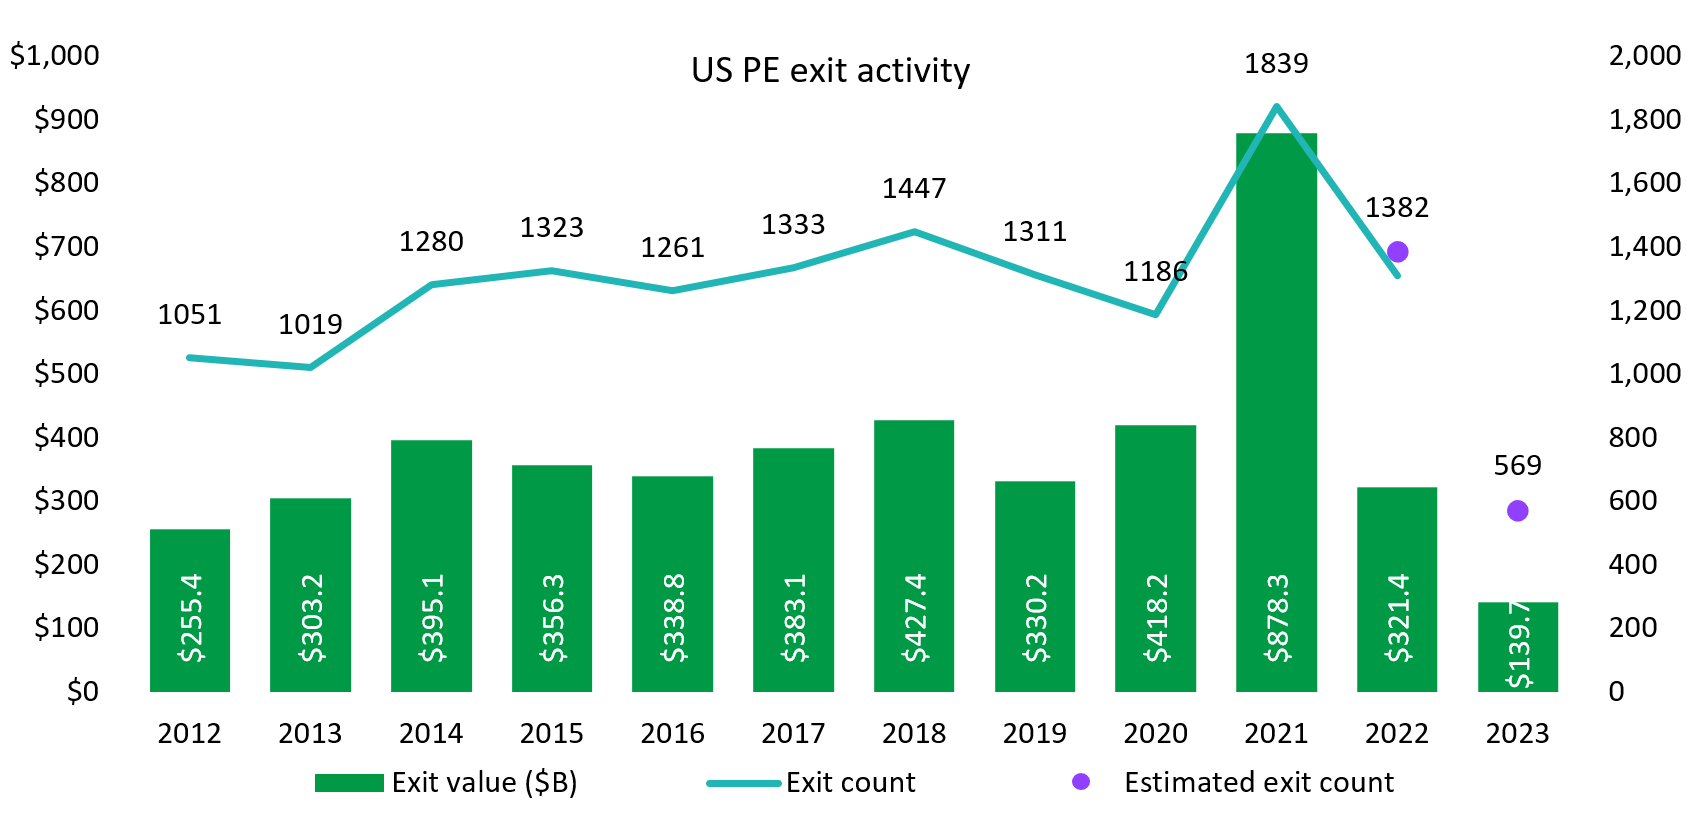
Source: PitchBook Q2 US PE Breakdown.
The uncertainty in valuation trajectory created an environment where buyers and sellers in the secondaries market are unable to agree on a transaction price with sellers thinking assets are worth more than buyers deem reasonable. Secondaries have experienced weaker volume as this valuation mismatch continues and as the bid-ask spread narrows, transaction volume should pick up and we should see more deals in 2H 20233.
Purchase price discounts are key in the underwriting and execution of a transaction. Discounts across secondaries reached recent lows in 2H 2022 of 78% of NAV which have since rebounded to 84% which is still below previous levels4. Buyout trades at the smallest discount while venture capital trades at the largest which is a trend we have seen over time; across all private markets, discounts bottomed in 2022, but we are starting to see some recovery pointing to increased investor confidence while still remaining at highly attractive levels4.
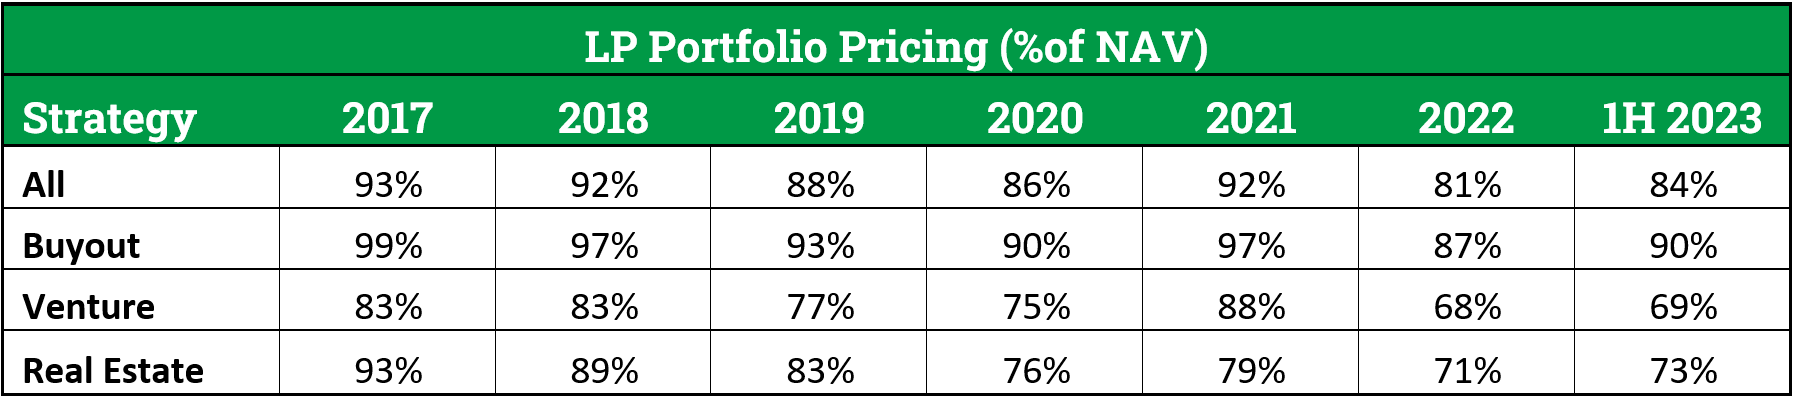
Source: Jefferies H1 2023 Global Secondary Market Review.
The largest discounts are in LP-led transactions versus GP-led with almost 75% of LP-led transactions trading at 89% of NAV or less while only 15% of GP-led transactions trade at that same discount level8.
Under normal circumstance in a more benign market, secondaries offer investors an attractive risk adjusted return profile and are an accretive allocation within their private markets portfolio. The recent reset in valuations has led to greater purchase price discounts providing more attractive entry points across the space. The weak exit environment has created a unique set of conditions where both GPs and LPs are seeking liquidity at above average volumes resulting from the pent-up demand and are open to less traditional avenues to obtain it. We are finding a lot of compelling opportunities in the secondaries market and have expanded our investment offering across buyout and venture capital secondaries to allow investors to capitalize on this goldilocks scenario with top-tier GPs. We anticipate these vintages will be stronger than average with the more robust opportunity set becoming a return enhancing allocation in private equity portfolios.
1 Averstad, Pontus, et al. “McKinsey Global Private Markets Review 2023: Private Markets Turn down the Volume.” McKinsey & Company, McKinsey & Company, 21 Mar. 2023, www.mckinsey.com/industries/private-equity-and-principal-investors/our-insights/mckinseys-private-markets-annual-review.
2 Kolchin, Katie, et al. “The Capital Markets Fact Book.” SIFMA, SIFMA, 24 July 2023, www.sifma.org/resources/research/fact-book/.
3 H1 2023 Global Secondary Market Review – Jefferies.Com.” H1 2023 Global Secondary Market Review, Jeffries, 2023, www.jefferies.com/CMSFiles/Jefferies.com/Files/IBBlast/Jefferies_Global_Secondary_Market_Review_July_2023_.pdf.
4 1H 2022 Global Secondary Market Review – Jefferies Group.” Jeffries, 2022, www.jefferies.com/CMSFiles/Jefferies.com/Files/IBBlast/1H2022-Jefferies-Global-Secondary-Market-Review.pdf.
5 Q2 2023 US pe breakdown. Pitchbook, 2023, July 11, https://pitchbook.com/news/reports/q2-2023-us-pe-breakdown
6 Pitchbook analyst note: Analyzing the IPO market outlook. Pitchbook, 2023, September 7, https://pitchbook.com/news/reports/q3-2023-pitchbook-analyst-note-analyzing-the-ipo-market-outlook
7 Global Private Market Fundraising Report. Pitchbook, 2023, August 21, https://pitchbook.com/news/reports/q2-2023-global-private-market-fundraising-report
8 Lazard Interim Secondary Market Report 2023. Lazard, 2023, September 7, https://www.lazard.com/research-insights/lazard-interim-secondary-market-report-2023/
Important Disclosures
This information is for general and educational purposes only. You should not assume that any discussion or information contained herein serves as the receipt of, or as a substitute for, personalized investment advice from Simon Quick Advisors & Co., LLC (“Simon Quick”) nor should this be construed as an offer to sell or the solicitation of an offer to purchase an interest in a security or separate accounts of any type. Asset Allocation and diversifying asset classes may be used in an effort to manage risk and enhance returns. It does not, however, guarantee a profit or protect against loss. Investing in Liquid and Illiquid Alternative Investments may not be suitable for all investors and involves a high degree of risk. Many Alternative Investments are highly illiquid, meaning that you may not be able to sell your investment when you wish. Risk of Alternative Investments can vary based on the underlying strategies used.
Please remember that past performance may not be indicative of future results. Different types of investments involve varying degrees of risk, and there can be no assurance that the future performance of any specific investment, investment strategy, or product (including the investments and/or investment strategies recommended or undertaken by Simon Quick), or any non-investment related content, made reference to directly or indirectly in this newsletter will be profitable, equal any corresponding indicated historical performance level(s), be suitable for your portfolio or individual situation, or prove successful. Due to various factors, including changing market conditions and/or applicable laws, the content may no longer be reflective of current opinions or positions. To the extent that a reader has any questions regarding the applicability of any specific issue discussed above to his/her individual situation, he/she is encouraged to consult with the professional advisor of his/her choosing. Simon Quick is neither a law firm nor a certified public accounting firm and no portion of the newsletter content should be construed as legal or accounting advice. If you are a Simon Quick client, please remember to contact Simon Quick, in writing, if there are any changes in your personal/financial situation or investment objectives for the purpose of reviewing/evaluating/revising our previous recommendations and/or services.
Simon Quick Advisors, LLC (Simon Quick) is an SEC registered investment adviser with a principal place of business in Morristown, NJ. Simon Quick may only transact business in states in which it is registered, or qualifies for an exemption or exclusion from registration requirements. A copy of our written disclosure brochure discussing our advisory services and fees is available upon request. References to Simon Quick Advisors as being “registered” does not imply a certain level of education or expertise.
This newsletter and the accompanying discussion include forward-looking statements. All statements that are not historical facts are forward-looking statements, including any statements that relate to future market conditions, results, operations, strategies or other future conditions or developments and any statements regarding objectives, opportunities, positioning or prospects. Forward-looking statements are necessarily based upon speculation, expectations, estimates and assumptions that are inherently unreliable and subject to significant business, economic and competitive uncertainties and contingencies. Forward-looking statements are not a promise or guaranty about future events.
Economic, index, and performance information herein has been obtained from various third party sources. While we believe the source to be accurate and reliable, Simon Quick has not independently verified the accuracy of information. In addition, Simon Quick makes no representations or warranties with respect to the accuracy, reliability, or utility of information obtained from third parties.
Historical performance results for investment indices and/or categories have been provided for general comparison purposes only, and generally do not reflect the deduction of transaction and/or custodial charges, the deduction of an investment management fee, nor the impact of taxes, the incurrence of which would have the effect of decreasing historical performance results. It should not be assumed that your account holdings correspond directly to any comparative indices or benchmark index, as comparative indices or benchmark index may be more or less volatile than your account holdings. You cannot invest directly in an index.
Indices included in this report are for purposes of comparing your returns to the returns on a broad-based index of securities most comparable to the types of securities held in your account(s). Although your account(s) invest in securities that are generally similar in type to the related indices, the particular issuers, industry segments, geographic regions, and weighting of investments in your account do not necessarily track the index. The indices assume reinvestment of dividends and do not reflect deduction of any fees or expenses.
Please note: Indices are frequently updated and the returns on any given day may differ from those presented in this document. Index data and other information contained herein is supplied from various sources and is believed to be accurate but Simon Quick has not independently verified the accuracy of this information.