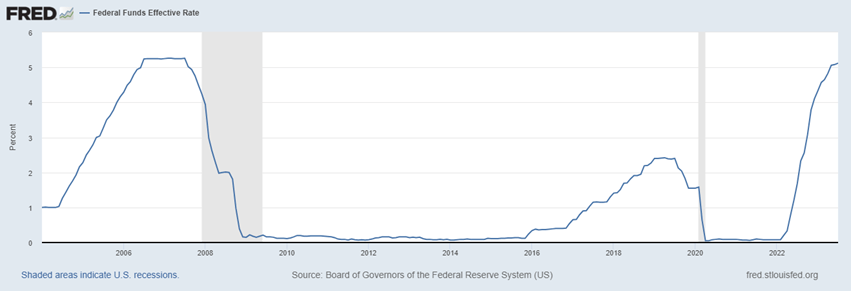
The last time interest rates (as measured by the Fed Funds Effective Rate) broke above 5% was in the second half of 2006, when Chairmen Greenspan and Bernanke tried to cool the white-hot housing market and stem the flow of easy credit amidst the leveraged buy-out boom. It took the Fed about two years to move rates up 4 percent, but stocks took these hikes in stride, generating positive returns during that period. Bonds were mixed, delivering positive returns overall, with 4.8% gains in the first year before giving back almost a percent in the second, but with overall relatively low volatility. Interest rates held at 5.25% for about a year, from mid-2006 to mid-2007, before it slowly, then suddenly fell to 0% by the end of 2008 amidst the Global Financial Crisis. Apart from the small hiking experiment between 2016 and 2019, short-term interest rates have essentially been held at zero for more than a dozen years.
The last time interest rates were above 5% was in 2006
We don’t assert that the current Fed hiking cycle is the same as what was experienced in 2004-2007, nor do we expect the same economic outcome, however, we recognize the similarities of a material move in interest rates higher followed by an anticipated long pause. In the current economic state, we expect the Fed to be near, if not already at, peak-rates after a 15-month hiking program. Chairman Powell is directing the market that rates will stay high for longer than what is currently expected. While inflation is declining, labor dynamics still remain tight. With reduced concern for a recession, the Central Bank feels confident the economy can bear tighter financial conditions, even if capital and credit markets soften, to cool the job market. Economists are expecting the first rate cut to come in early 2024, which is already about two quarters later than originally anticipated. While Fed dot plots indicate lower rates next year, Powell has noted that we may not see those lower rates until the latter half of 2024.
So then, what did markets do in the mid-2000s that might be relevant to the current period of high rates we’re experiencing today? In that relative calm of a rate pause at 5.25% (July 2006-June 2007), stocks rallied another 20%, and bonds over 6%. More economically sensitive small cap stocks and high yield bonds were both up double-digits. These were much more attractive returns than the sub-5% yields generated from 3-month Treasury Bills over that same period. However, we want to focus less on the potential upside of stocks in a benign economy, rather we turn our attention to the diversifying elements of bonds and the value of longer-duration fixed income instruments in periods of uncertainty.
The current argument for owning money markets and short-term treasuries today is the security of that principal from mark-to-market effects while still collecting a relatively high income versus longer-dated fixed income instruments. We believe a lot of this bias stems from the recently awful experience of bonds in 2022, where high quality fixed income lost 13% in the year while T-bills were up about 1.76%. Bonds had to rapidly reprice to more normal interest rates and the value of securities fell to account for the lower fixed coupon they paid out. Today, we believe bonds are closer to a state of equilibrium with rate expectations. With lower interest rate sensitivity, bonds are also now positioned to more effectively diversify and preserve capital than T-bills can.
But, that thesis has yet to play out this year as 90-day T-bills have returned 2.8% through July, while Treasuries and investment grade bonds had returned between 1-2%. Looking at real-time August performance with continued yield expansion, bonds have further weakened and are now slightly down on the year. We would note that the recent bond weakness is more technically driven away from the result of Fed actions, but disappointing nonetheless. We view this as short-term volatility and relatively contained, and the benefit of portfolio hedging and long-term yield generation is well-worth the small cost.
The inverted yield curve, where shorter-term bonds are providing a higher yield than longer-maturity bonds, also causes a lack of appetite for taking greater bond risk, since investors are not compensated for keeping capital outstanding for longer than if you kept it very short. We do not think the curve can stay inverted for too long without a market correction, and the diversification benefit and potential gains of longer duration assets is much more impactful than short-dated in a recessionary period. We note that the 2006 period also experienced an inverted yield curve, albeit shallower than today, that played out tremendously for longer-dated bonds over T-bills.
Referring back to the prior high-rate period of the 18 months between July 2007 and December 2008, when the Fed cut rates as the financial crisis emerged, stocks sold off almost 40%, but bonds rallied over 11%. Three-month T-bills generated a modest 3.5% (as investors couldn’t continue to reinvest in the original higher rates). Over that period, bonds averaged a return of over 0.5% per month, in comparison to T-bills at less than 0.2%. More than half of the gains came early, in the first 6 months of the easing cycle, returning more than what T-bills offered at that time for a whole year. Obviously, this prices in a 5.25% cut to interest rates in 2008, which we may only see about half of this time around, but that is directionally the hedging experience we seek in a case of a slowing economy and Fed pivot for next year.
During 2009 and 2010, in the recovery from the GFC, bonds returned approximately 6% per year, while T-bills annualized at less than 0.2%. Obviously, with a normalized yield curve, T-bill investors would likely extend duration but could miss the bulk of the fixed income rally before making that rotation. This is the type of hedging and performance we expect from fixed income in a diversified portfolio.
Stock, Bond, and T-Bill Performance before, during, and after the GFC
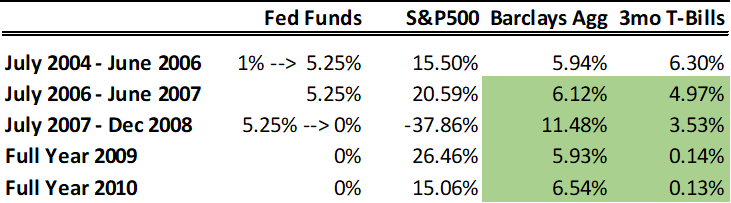
Source: Simon Quick Research
Short-term funds, whether via money markets or T-Bills, can function as a component of a fixed income strategy, but shouldn’t serve as the entirety of it, if one seeks proper asset diversification. Tactically, as rates are likely near peaks, owning fixed income duration assets can be very accretive to investment portfolios, serving as an appreciating source of capital in more volatile markets. We continue to like high quality, intermediate term bonds. Taking modest credit risk, while still staying investment grade, into corporate and securitized bonds, investors can achieve 6% or greater yields in defensive assets. We would also substitute some equity exposure for lower-investment grade/higher-quality high yield bonds, which are currently yielding 8-10% today. Both stocks and high yield credit are economically sensitive, but bonds exhibit lower volatility than stocks and most are trading below face value today, allowing for natural accretion higher to par, while stocks need to justify their higher multiples today.
Fixed Income Yields Have More than Doubled Since 2021
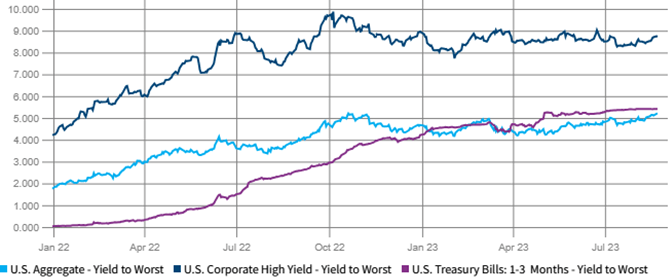
Source: Simon Quick Research, Barclays, Bloomberg
Asset Allocation Recommendations
Equities: Under-weight
The strong rally into July 2023 had put the S&P500 at about 3 percent off its late 2021 highs, recovering from its 18% loss last year. This performance came despite material bank pressures and still rising rates, as consumer spending more than offset these challenges. However, businesses continue to get more defensive as liquidity and credit availability have deteriorated. There have been increased calls for a soft economic landing as the Fed also believes a recession can be avoided. However, we think higher valuations, declining capex by businesses, and slowing spend by consumers will be headwinds to further market appreciation and thus think it opportune to take these early gains and diversify into more defensive, income-producing assets to create resiliency in portfolios.
We reiterate that high valuations do not leave enough margin for error, notably as interest rates will likely remain high, thus the hurdle for riskier investments is also higher.
Value versus Growth: We maintain a relatively balanced approach to Value versus Growth styles, but with a slight bias to Defensive portfolios that exhibit greater business resiliency in economic slowing. These managers would be more protective in a market sell-off, but lag in a market rally.
Large versus Small: We complement our Large Cap Defensive exposure with selective, active small- and mid-cap funds. Small caps tend to be more economically sensitive, so we look to be more valuation-conscious in this segment.
Domestic versus International: We maintain an overweight to Domestic stocks, based on the quality of businesses and depth of capital markets in the US. We are modestly underweight Emerging Markets.
Fixed Income: Over-weight
We are Over-weight fixed income via a barbelled approach of investment grade bonds (for some income generation but to also serve as an equity market hedge) and floating rate credit (with attractive income distribution in a higher rate environment and still benign default experience) to complement and diversify away from stocks. The traditional fixed income allocation is highly liquid and can be quickly reinvested into other opportunities that may present themselves in a more challenged market. Floating rate debt exposure is currently offering equity-like return potential while moving up in capital structure seniority and reducing overall portfolio volatility versus equities.
Interest Rate Sensitivity: We had extended our duration as the Fed raised rates throughout 2022. We may have another hike later this year in 2023, but believe a 5%+ interest rate environment can easily absorb it without suffering material impact to performance. Additionally, if a recession were to come sooner and more severe than anticipated, rate cuts would follow, which would be most beneficial to longer-term bonds. The inverted yield curve makes it challenging to buy 4% 10-year bonds, versus 5%+ 1-year debt, however floating rate and investment grade credit spreads more than compensate for that difference.
Credit Quality: We seek to maintain an overall investment grade credit quality in our liquid fixed income exposures, however would balance this positioning with illiquid direct lending and structured credit investments that exhibit strong equity-like returns despite lower volatility. We are currently limiting this high yield exposure to alternative credit strategies and private investment opportunities that are less sensitive to daily flows and mark-to-market variability.
Liquid Alternatives: Target-weight
Hedge Funds: Under the surface of strong performance from the mega-cap equities is greater volatility and opportunities for price discovery across asset classes, particularly smaller stocks and credit. This is creating a ripe opportunity for diversified and long/short hedge funds. Strategies that can take advantage of short-term pricing dislocations can offer return enhancement and better resiliency to bouts of volatility. We are exploring specialized lending opportunities that are complementary to traditional direct lending while diversifying away business cycle risk.
Real Estate: We have been adding core-plus real estate opportunities, notably in residential assets for its inflation aligned properties and as a complement to stock and bond portfolios.
Illiquid Alternatives: Target-weight
Valuations adjusted lower, following public market declines in 2022. Committed capital for opportunistic deployment over the next few years should make this vintage of fundraises highly attractive.
Secondaries and Distressed investing strategies may benefit well from a slowing economy as they tend to be opportunistic buyers of good assets at discounted valuations, during a period of market uncertainty. The next couple years may be an attractive time to be an opportunistic buyer of real estate assets that may be unsold or facing refinancing pressures. We have added opportunistic real estate and special situations investment funds that can take advantage of temporary market dislocations that should generate attractive IRR over relatively short investment periods to complement traditional private equity and venture opportunities.
Important Disclosures
This information is for general and educational purposes only. You should not assume that any discussion or information contained herein serves as the receipt of, or as a substitute for, personalized investment advice from Simon Quick Advisors & Co., LLC (“Simon Quick”) nor should this be construed as an offer to sell or the solicitation of an offer to purchase an interest in a security or separate accounts of any type. Asset Allocation and diversifying asset classes may be used in an effort to manage risk and enhance returns. It does not, however, guarantee a profit or protect against loss. Investing in Liquid and Illiquid Alternative Investments may not be suitable for all investors and involves a high degree of risk. Many Alternative Investments are highly illiquid, meaning that you may not be able to sell your investment when you wish. Risk of Alternative Investments can vary based on the underlying strategies used.
Please remember that past performance may not be indicative of future results. Different types of investments involve varying degrees of risk, and there can be no assurance that the future performance of any specific investment, investment strategy, or product (including the investments and/or investment strategies recommended or undertaken by Simon Quick), or any non-investment related content, made reference to directly or indirectly in this newsletter will be profitable, equal any corresponding indicated historical performance level(s), be suitable for your portfolio or individual situation, or prove successful. Due to various factors, including changing market conditions and/or applicable laws, the content may no longer be reflective of current opinions or positions. To the extent that a reader has any questions regarding the applicability of any specific issue discussed above to his/her individual situation, he/she is encouraged to consult with the professional advisor of his/her choosing. Simon Quick is neither a law firm nor a certified public accounting firm and no portion of the newsletter content should be construed as legal or accounting advice. If you are a Simon Quick client, please remember to contact Simon Quick, in writing, if there are any changes in your personal/financial situation or investment objectives for the purpose of reviewing/evaluating/revising our previous recommendations and/or services.
Simon Quick Advisors, LLC (Simon Quick) is an SEC registered investment adviser with a principal place of business in Morristown, NJ. Simon Quick may only transact business in states in which it is registered, or qualifies for an exemption or exclusion from registration requirements. A copy of our written disclosure brochure discussing our advisory services and fees is available upon request. References to Simon Quick Advisors as being “registered” does not imply a certain level of education or expertise.
This newsletter and the accompanying discussion include forward-looking statements. All statements that are not historical facts are forward-looking statements, including any statements that relate to future market conditions, results, operations, strategies or other future conditions or developments and any statements regarding objectives, opportunities, positioning or prospects. Forward-looking statements are necessarily based upon speculation, expectations, estimates and assumptions that are inherently unreliable and subject to significant business, economic and competitive uncertainties and contingencies. Forward-looking statements are not a promise or guaranty about future events.
Economic, index, and performance information herein has been obtained from various third party sources. While we believe the source to be accurate and reliable, Simon Quick has not independently verified the accuracy of information. In addition, Simon Quick makes no representations or warranties with respect to the accuracy, reliability, or utility of information obtained from third parties.
Historical performance results for investment indices and/or categories have been provided for general comparison purposes only, and generally do not reflect the deduction of transaction and/or custodial charges, the deduction of an investment management fee, nor the impact of taxes, the incurrence of which would have the effect of decreasing historical performance results. It should not be assumed that your account holdings correspond directly to any comparative indices or benchmark index, as comparative indices or benchmark index may be more or less volatile than your account holdings. You cannot invest directly in an index.
Indices included in this report are for purposes of comparing your returns to the returns on a broad-based index of securities most comparable to the types of securities held in your account(s). Although your account(s) invest in securities that are generally similar in type to the related indices, the particular issuers, industry segments, geographic regions, and weighting of investments in your account do not necessarily track the index. The indices assume reinvestment of dividends and do not reflect deduction of any fees or expenses.
Please note: Indices are frequently updated and the returns on any given day may differ from those presented in this document. Index data and other information contained herein is supplied from various sources and is believed to be accurate but Simon Quick has not independently verified the accuracy of this information.