
Stocks and bonds have traditionally served as the two foundational assets that investors needed to own in order to build diversified portfolios. Bonds, while lower returning, were reliable in their regularly scheduled coupon payments to support steady income generation with limited price volatility. Stocks, on the other hand, have exhibited more than double the amount of volatility of bonds and make it very difficult to set short-term return expectations; however, they have driven significantly more wealth creation over longer-term periods. By owning both assets in a portfolio, an investor would be able to reduce volatility and improve their confidence around annual returns. This is depicted in the graph and table below. The ends of the diagonal, dotted line depict the average annual return per unit of risk for stocks and bonds over the past forty years. Portfolios that are above the line generated higher returns for lower risk. Portfolios that fall below the line still generated positive returns but took greater risk than necessary to achieve it. Owning a balanced portfolio of stocks and bonds (50% Stocks/50% Bonds) that is rebalanced annually has resulted in higher returns for each unit of risk (as measured by volatility) than either asset can achieve on its own.
Average Annual Returns and Volatility between 1982-2021
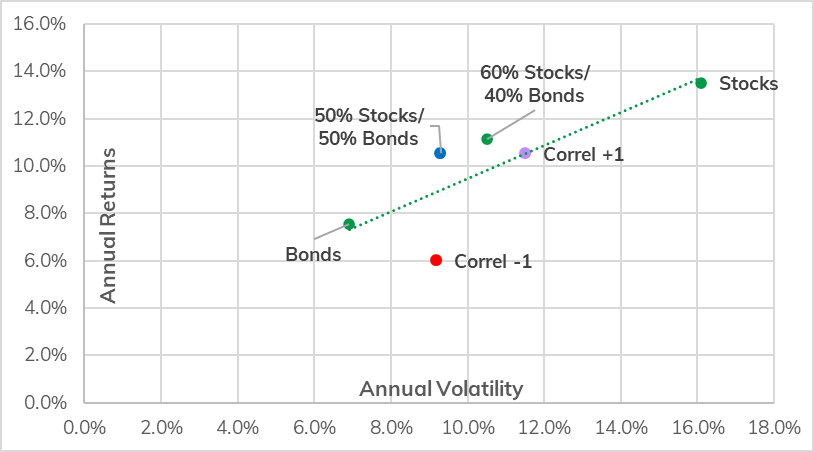
To be clear, the power of diversification isn’t simply about mixing high-risk investments with low-risk ones. Rather, diversification is enhanced or diminished by how closely the components move together. The more independent asset classes are from one another, the more resilient the portfolio becomes to market volatility. To put this in context, stocks and bonds should both typically generate a positive return over time, albeit over a different time period, level of volatility level of return. If stocks and bonds moved in lockstep, directionally up or down (noted as “Correlation +1” above), bonds would dampen volatility in a stock portfolio but would not afford any further benefits of risk reduction. In the chart above, this would be the PURPLE dot ON the line in the middle of stocks and bonds. A highly correlated portfolio will likely remain close to the efficient frontier and not afford greater value to the investor.
Conversely, stocks and bonds behave like mirror images of each other (noted as the RED “Correlation -1” dot above), where if stocks go up, bonds MUST go down, and vice versa would result in the highest amount of risk reduction, but would sacrifice too much in returns and thus be highly inefficient. This is because each asset is actively fighting against the other’s movements, which creates a notable drag on performance.
Summarizing the two preceding paragraphs, the ideal relationship between assets is where their performance isn’t tied to the behavior of the other (Correlation closer to O); rather, BOTH have the opportunity to generate positive returns irrespective of what the other asset class does. In the context of stocks and bonds, the two asset classes have exhibited a less than 0.2 correlation over the past forty years. This has allowed for a balanced stock and bond portfolio to return the same average annual return of a Correlation +1 portfolio but with meaningfully lower risk (about 20% better), capturing 78% of the performance of an all-stock portfolio for only 58% of the risk. This is represented by the BLUE dot on the chart above.
Then what’s happening this year?
Capital markets theory is all well and good, but we have just seen a year where stocks and bonds have exhibited a strong positive correlation (+0.7 for the last 12 months through November), and unfortunately, it has been to the downside as the S&P500 and Barclays US Agg indices both lost approximately 13% for the year through November. So why did this happen?
It all started with an unhealthy relationship with TINA… ”there is no alternative.” On the back of the 2008 financial crisis, the Fed Funds rate fell to 0% from its 5%+ prior peak in 2007. Since then, banks and borrowers benefitted from an environment where there was practically zero cost to borrow from the government for over a dozen years. Money was practically free to spend or invest. Chairman Powell attempted to raise rates early in his tenure and had moved Fed Funds up to about 2.5% but had to retrace about 0.75% of that to calm market angst even before we fell into the grips of COVID. As the pandemic took hold, we returned to a zero-rate environment and remained there for another two years before the current rate hiking program began this year. The market grew accustomed to a highly accommodative central bank, which drove bond yields down to a 1-2% range during this period and stock valuations north of 20-times forward Price-to-Earnings multiples. There were minimal returns to be made in bonds, and with the Fed backstop in place, investors piled into equities as there was no alternative to grow wealth.
The inflation shock and subsequent rapid rate hiking program undertaken by the central bank this year has created a dramatic repricing of both stocks and bonds. Stock market declines have largely been driven by valuations falling over 20% to around 17.5x forward-P/E while earnings fundamentals, albeit slowing, have remained positive. While the move down in stocks is uncomfortable, it is not uncommon for stocks to have sudden and rapid bouts of volatility. What has been more unsettling is the inability for bonds to mitigate equity declines like they had in the past.
Stock and Bond Drawdowns since 2000
![]()

Source: YCharts, Simon Quick Research
We attribute this to the hangover of TINA as the Fed raises rates to stem inflation. It is notably the speed and magnitude at which rates are moving that has caused significant bond volatility, which was exacerbated by starting off in such a low-yield environment. Since the first hike in March, the Fed has raised rates six times this year, with another anticipated in December, equating to likely 4.25% of hikes in nine months. Not only would this be the fastest hiking program since Volcker led the Fed in the early ’80s, but it would also be the largest change to the Fed Funds rate since that period.
Duration and Magnitude of Fed Rate Hikes
|
Period
|
# of Months
|
Change in Fed Funds
|
Inflation Rate at Start of Cycle
|
|---|---|---|---|
| March 1988 – May 1989
|
14
|
3.23
|
3.60%
|
| February 1994 – February 1995
|
12
|
2.67
|
2.06%
|
| June 1999 – May 2000
|
11
|
1.51
|
1.40%
|
| June 2004 – June 2006
|
24
|
3.96 | 2.89%
|
| December 2015 – December 2018
|
36
|
2.03
|
0.30%
|
| March 2022 – November 2022*
|
8
|
3.75
|
6.77%
|
Source: Visual Capitalist, Simon Quick Research *and the Fed’s not done yet…
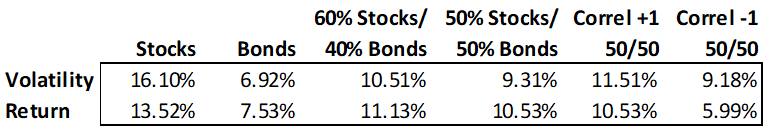
As bonds started off in the rate hiking cycle with significantly lower yields, the repricing of fixed income assets was significant as there was a very limited benefit of interest income to offset valuation declines. This sort of price action is highly irregular for bonds as there have been only four negative returning years for the Barclays Agg since 1980, with the largest loss being only 3% in 1994.
Annual Returns for Stocks and Bonds
Source: Simon Quick Research
Time to Meet TARA
Because of this negative move in bonds, there have been plenty of headlines about how the 60/40 portfolio model is dead. We agree that it was appropriate to have limited traditional fixed income exposure when interest rates were hovering around 0% and to be predominantly skewed towards shorter-duration and floating rate credit instruments where there was exposure. However, our interest in fixed income investments has increased with the recent sell-off in the asset class. With higher rates and economic uncertainty, there are reasonable alternatives (“TARA”) that are now available in fixed income and hedge fund strategies to diversify away from previously stock-heavy portfolios.
For fixed income, the benchmark index is now yielding almost 4.5%, up from 1.75% at the beginning of the year. Investment grade corporate bonds are yielding over 5%, and floating rate high yield loans are offering over 10%, which are 3% and 4% better than the start of the year, respectively. Furthermore, the Fed has made indications that while there will be more rate hikes to come, they will likely be at a slower pace and magnitude than what was experienced of late. We believe the majority of the reset in fixed income prices is now behind us. Today, as the economy slows, fixed income instruments that can return mid- to high-single-digit yields create stable income for a portfolio in the face of equity market uncertainty. Furthermore, we believe the Fed has been hiking aggressively to allow for the ability to cut rates modestly in the future if the economy stumbles more than anticipated. In that event, fixed income assets should protect and likely deliver principal appreciation to portfolios even when equities sell off.
In the era of TINA, opportunities in hedge funds were relatively muted as low rates, and commensurately lower market volatility constrained the return potential of idea generation and unique stock-picking in contrast to simply owning the largest companies in the stock market. Hedging stock risk via shorts felt more like a Correlation -1 strategy than a diversifying one. Low inflation and rates had kept real asset appreciation at bay. However, this newer regime of higher rates and volatility has reinvigorated opportunities in fixed income and currencies, commodities, and arbitrage strategies. Even traditional long-short equity funds are finding better hedged opportunities resulting in more attractive risk-adjusted returns than long-only stock and bond portfolios. To that end, we have been expanding our exposure to macro and arbitrage strategies as well as multi-manager funds. We continue to diligence real asset strategies to diversify traditional stock- and bond-based exposures, as well as to potentially capitalize on a higher inflationary and natural resource demand driven cycle.
ASSET ALLOCATION RECOMMENDATIONS
Equities: Target-weight
Stocks have rebounded off the mid-October lows on the hopes of a slowing interest rate hiking cycle and better than expected third quarter earnings. While consumers continue to purchase into the holiday season and companies have been able to maintain margins, there is a risk of softening and lower guidance which hasn’t been meaningfully modeled into 2023 analysts’ forecasts. While we are long-term believers in equities, this late-year rally seems to be more technically driven than based on fundamentals, and thus we would be measured in adding on continued strength. While we’ve held off a recession this year, indications point to the likelihood of it occurring next year. We continue to increase our allocation to quality-oriented managers that should be able to better weather economic instability during this period. European energy and China COVID pressures keep us domestically focused. The Dollar remains strong versus other currencies but is coming off its highs, which has been a recent tailwind to international portfolios. We are willing to forego some of the short-term upside outside the US to be more defensively positioned overall.
Fixed Income: Target-weight
We have been steadily increasing duration and credit quality within our liquid fixed income allocation throughout the course of the year. While we may have been a little early, as the Fed has been even more hawkish than we anticipated, investment grade bonds now provide a yield that is multiples higher than what it was over the past several years. Furthermore, if a recession is on the horizon, owning higher quality assets that will benefit from a Fed pivot, and serve as a positive counterbalance to stocks seems warranted. We continue to emphasize alternative credit strategies that can generate meaningfully higher returns than those in liquid markets. These include private corporate and real estate lending and structured credit. We anticipate higher defaults than what we experienced in the past few years; however, higher returns from higher rates should more than compensate investors for that risk.
Liquid Alternatives: Target-weight
After several years of a relatively dry spell for returns, we think heightened volatility across asset classes is creating a ripe opportunity for diversified and long/short hedge funds. As traditional assets continue to remain under pressure, strategies that can take advantage of short-term pricing dislocations in a choppy market can generate more consistent returns through this challenging period. Furthermore, we have been adding residential real estate for its inflation-aligned properties as a complement to stock and bond portfolios. We are currently exploring opportunities within natural resources where years of underinvestment may drive higher prices for the commodity, as well as drive long-term capital investment into the industry, particularly as countries seek to control their own supply chains in the midst of geopolitical and COVID concerns.
Illiquid Alternatives: Target-weight
Private equity investments across venture, growth, and buy-out are currently seeing valuations adjust lower, similar to the price adjustments we are seeing for public markets that started earlier in the year. This will likely persist for the next few quarters and slow the pace of buy and sell activity in the near-term but will establish an attractive period to be an investor in private businesses for the long-term for those who have the capital to deploy. Secondaries and Distressed investing strategies may benefit well from a slowing economy as they tend to be opportunistic buyers of good assets at discounted valuations during a period of market uncertainty.
Important Disclosures
This information is for general and educational purposes only. You should not assume that any discussion or information contained herein serves as the receipt of, or as a substitute for, personalized investment advice from Simon Quick Advisors & Co., LLC (“Simon Quick”) nor should this be construed as an offer to sell or the solicitation of an offer to purchase an interest in a security or separate accounts of any type. Asset Allocation and diversifying asset classes may be used in an effort to manage risk and enhance returns. It does not, however, guarantee a profit or protect against loss. Investing in Liquid and Illiquid Alternative Investments may not be suitable for all investors and involves a high degree of risk. Many Alternative Investments are highly illiquid, meaning that you may not be able to sell your investment when you wish. Risk of Alternative Investments can vary based on the underlying strategies used.
Please remember that past performance may not be indicative of future results. Different types of investments involve varying degrees of risk, and there can be no assurance that the future performance of any specific investment, investment strategy, or product (including the investments and/or investment strategies recommended or undertaken by Simon Quick), or any non-investment related content, made reference to directly or indirectly in this newsletter will be profitable, equal any corresponding indicated historical performance level(s), be suitable for your portfolio or individual situation, or prove successful. Due to various factors, including changing market conditions and/or applicable laws, the content may no longer be reflective of current opinions or positions. To the extent that a reader has any questions regarding the applicability of any specific issue discussed above to his/her individual situation, he/she is encouraged to consult with the professional advisor of his/her choosing. Simon Quick is neither a law firm nor a certified public accounting firm and no portion of the newsletter content should be construed as legal or accounting advice. If you are a Simon Quick client, please remember to contact Simon Quick, in writing, if there are any changes in your personal/financial situation or investment objectives for the purpose of reviewing/evaluating/revising our previous recommendations and/or services.
Simon Quick Advisors, LLC (Simon Quick) is an SEC registered investment adviser with a principal place of business in Morristown, NJ. Simon Quick may only transact business in states in which it is registered, or qualifies for an exemption or exclusion from registration requirements. A copy of our written disclosure brochure discussing our advisory services and fees is available upon request. References to Simon Quick Advisors as being “registered” does not imply a certain level of education or expertise.
This newsletter and the accompanying discussion include forward-looking statements. All statements that are not historical facts are forward-looking statements, including any statements that relate to future market conditions, results, operations, strategies or other future conditions or developments and any statements regarding objectives, opportunities, positioning or prospects. Forward-looking statements are necessarily based upon speculation, expectations, estimates and assumptions that are inherently unreliable and subject to significant business, economic and competitive uncertainties and contingencies. Forward-looking statements are not a promise or guaranty about future events.
Economic, index, and performance information herein has been obtained from various third party sources. While we believe the source to be accurate and reliable, Simon Quick has not independently verified the accuracy of information. In addition, Simon Quick makes no representations or warranties with respect to the accuracy, reliability, or utility of information obtained from third parties.
Historical performance results for investment indices and/or categories have been provided for general comparison purposes only, and generally do not reflect the deduction of transaction and/or custodial charges, the deduction of an investment management fee, nor the impact of taxes, the incurrence of which would have the effect of decreasing historical performance results. It should not be assumed that your account holdings correspond directly to any comparative indices or benchmark index, as comparative indices or benchmark index may be more or less volatile than your account holdings. You cannot invest directly in an index.
Indices included in this report are for purposes of comparing your returns to the returns on a broad-based index of securities most comparable to the types of securities held in your account(s). Although your account(s) invest in securities that are generally similar in type to the related indices, the particular issuers, industry segments, geographic regions, and weighting of investments in your account do not necessarily track the index. The indices assume reinvestment of dividends and do not reflect deduction of any fees or expenses.
Please note: Indices are frequently updated and the returns on any given day may differ from those presented in this document. Index data and other information contained herein is supplied from various sources and is believed to be accurate but Simon Quick has not independently verified the accuracy of this information.