Equity markets have experienced a strong first half for 2024. Despite some sticky inflation readings in the first quarter, inflation has continued to moderate while economic activity remains resilient. Stocks have responded positively to the growing likelihood of interest rate cuts by the Fed as a soft landing for the economy has become the consensus view.
The S&P advanced over 15% through June, strongly outperforming most global indices. US stock market exceptionalism has persisted as investors continue to pile into the artificial intelligence theme – headlined by Nvidia and the Magnificent 7 cohort. Market breadth has remained extremely narrow – with the Magnificent 7 accounting for over 60% of the S&P’s returns. Comparatively, an equal weighted S&P 500 is up just 5% on the year, while Small Capitalization companies are up less than 2%. This has led to the S&P trading at valuations well above its long-term average.
To date, the Mag 7 has justified this outperformance with stellar earnings performance. After an earnings slowdown in 2022, this cohort of companies have generated significant earnings growth while the remaining S&P companies saw earnings contract. The buildout of data centers designed to power artificial intelligence has been a major driver of this earnings growth – particularly for Nvidia. However, into the end of 2024 and 2025, earnings growth is expected to widen considerably which could be supportive of a broadening of the equity rally.
Although market participants were caught off-guard with a delayed start to the interest rate cutting cycle, more recent renewed optimism from the Fed on the progress on inflation is driving expectations for rate cuts by year end. Despite shelter & service costs remaining elevated, CPI and Core CPI hit 3.0% and 3.3%, respectively – a nearly 6% decline from the highs of 2022.
A key driver behind the expectations for rate cuts has been a noticeably softening labor market. A variety of labor market measures have returned to more normalized levels in recent months, particularly job openings, quit rates, and monthly jobs added. This added slack in labor markets has contributed to wage gains moderating considerably.
Labor markets remain generally in a very strong position – highlighted by a still low level of unemployment – but signs of further weakening could contribute to a broader based slowdown and is being monitored by market participants. One encouraging sign is that household balance sheets are still in a strong position with debt coverage ratios still below pre-COVID levels. This should allow for US households to be able to withstand a modest weakening of the labor market.
Due to the market pricing in interest rate cuts so aggressively in late 2023, high quality fixed income markets remain in negative territory through the first half of the year. The yield curve has steepened over this period as expectations for deficit spending to persist beyond the 2024 elections, regardless of the winner, have pushed longer dated yields higher. Credit spreads however have generally tightened given the risk-on attitude in markets, leading to strong performance high yield, leveraged loans, and private credit.
Market Overview
Equity markets had a strong first half of the year as optimism surrounding artificial intelligence and continued hopes for a soft landing drove markets. Interest rate sensitive investments have lagged in this environment as expectations for easing monetary policy continue to be pushed back.
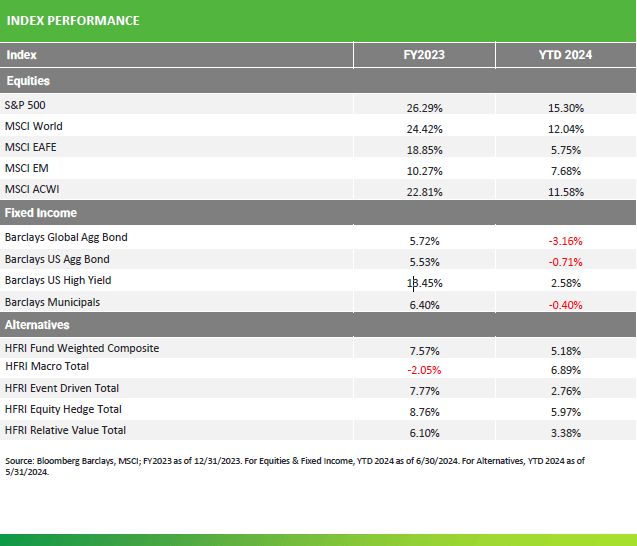
Source: Bloomberg Barclays, MSCI; FY2023 as of 12/31/2023. For Equities & Fixed Income, YTD 2024 as of 6/30/2024. For Alternatives, YTD 2024 as of 5/31/2024.
The Info Tech sector, notably Nvidia, and Communication Services have seen strong performance in 2024 as the AI theme continues to drive performance.
The Magnificent 7 cohort has remained the dominant driver of performance, accounting for over 60% of the index’s return through June.
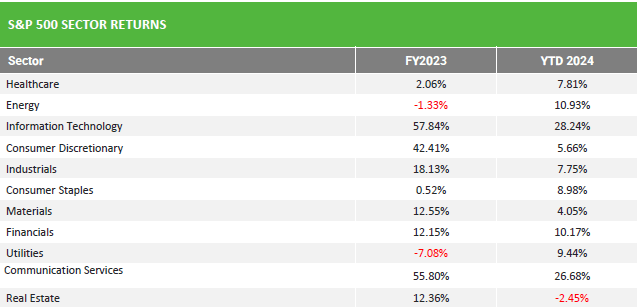
Source: Bloomberg; FY2023 as of 12/31/2023;. 2024 YTD as of 6/30/2024.
U.S. Equity Style & Market Capitalization Returns
Large Cap Growth remains the driver of market performance as the semiconductor industry in particular has seen tremendous earnings growth from the AI theme.
Small Caps remain a laggard as the market continues to have a bias towards quality in today’s uncertain rate environment.
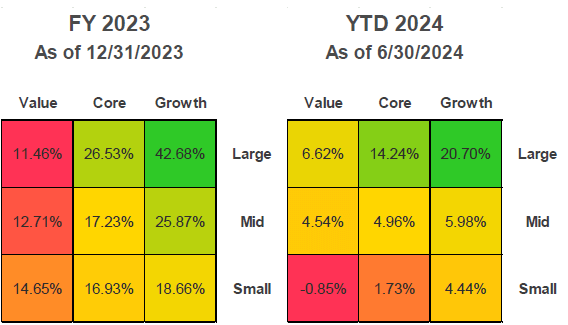
Source: Bloomberg
Equity Market Breadth Narrows
After a brief period of widening breadth from Q4 ’23 to Q1 ‘24, the continued dominance of the S&P 500 and the Magnificent 7 have returned to markets. A more diversified & equally weighted S&P 500 along with Small Capitalization companies have lagged considerably in this environment.
Equity Market Performance Since 2022
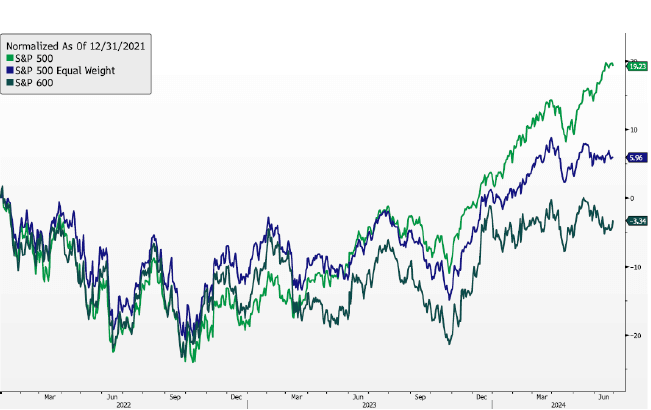
Source: Bloomberg. As of 6/30/2024
Valuations Remain Full
Valuations for the S&P 500 remain in the higher end of its historic range as the Magnificent 7 and other AI beneficiaries have driven multiples higher.
Outside of this expensive cohort, valuations appear much more reasonable. However, cyclicality and financing risk become more prevalent and may justify the lower valuations for these areas of the market.
Forward Price to Earnings Ratios
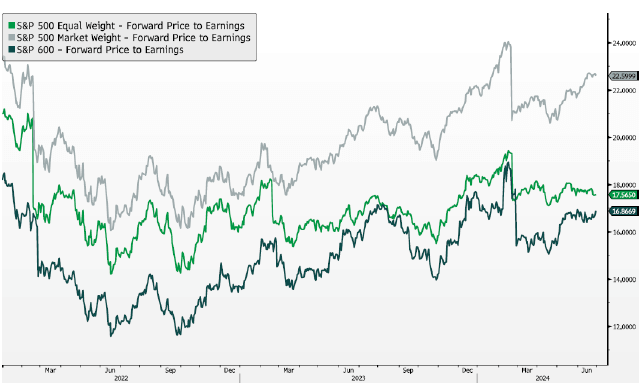
Source: Bloomberg. As of 6/30/2024
Earnings Growth Expected to Broaden
The Magnificent 7 has seen tremendous earnings growth to justify the increase in prices & valuations, but there are expectations for earnings growth to broaden out over the course of the year.
Earnings Growth of the Mag 7 vs S&P ex-Mag 7
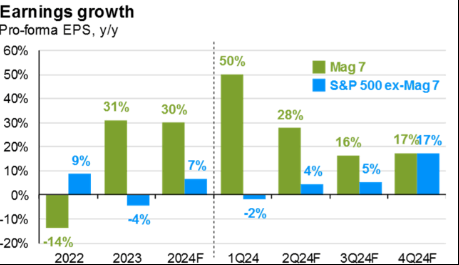
Source: JP Morgan. As of 6/30/2024
Inflation Moderates
After seeing progress stall in Q1, the downward trend in CPI continued in the second quarter of 2024 as labor markets continue to loosen. However, persistently elevated shelter and service costs have kept inflation above the Fed’s target.
Consumer Price Inflation Year-Over-Year
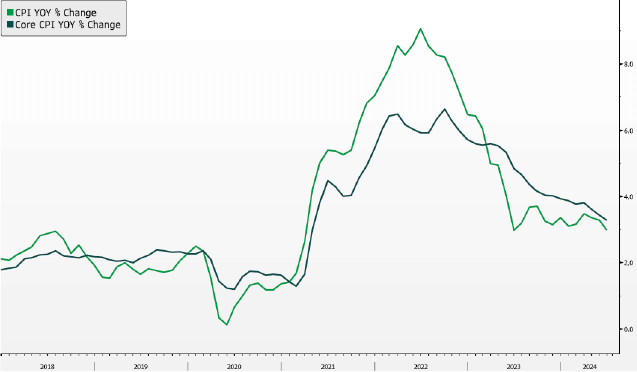
Bloomberg. As of 6/30/2024
Labor Markets Normalize
Despite elevated inflation, the prospects of rate cuts are considered more likely as labor market slack continues to normalize.
One sign of normalization has been the JOLTS Job Openings which have seen a steady decline since peaking in 2022. Wage growth has similarly slowed as a reflection of a more balanced labor market.
US Job Openings & Wage Growth Rate
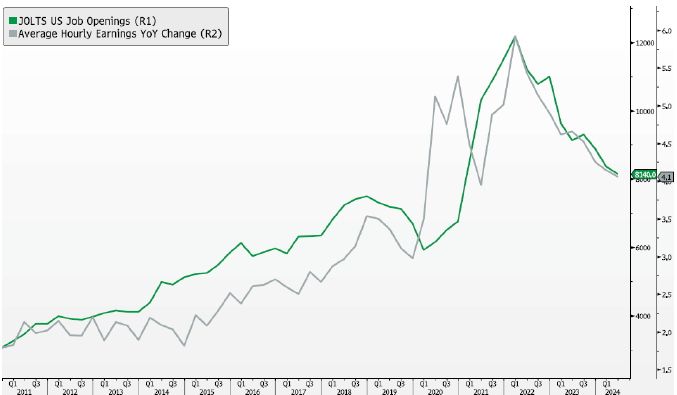
Source: Bloomberg. As of 6/30/2024
Concurrently, there has been a steady decline in the number of jobs added each month as jobless claims have consistently risen.
While not yet at levels that precede recessions, signs of a more rapidly deteriorating labor market are being monitored closely.
US Continuing Jobless Claims & Nonfarm Jobs Added
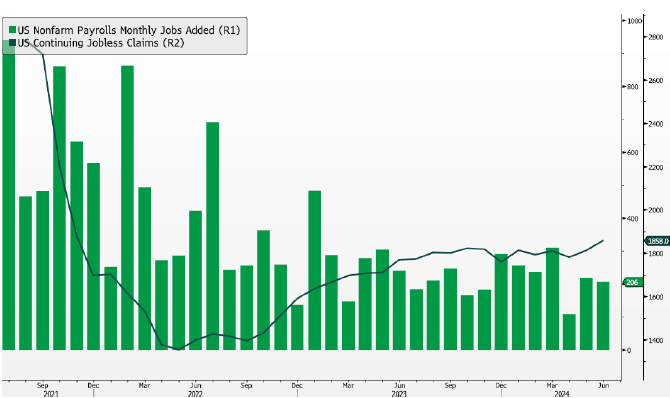
Bloomberg. As of 6/30/2024
Household Balance Sheets Remain Strong
However, households themselves remain in a highly insulated position to service debt, with debt service coverage ratios still below the pre-COVID levels.
The strength of household balance sheets should offer some resilience for consumption if labor markets continue to weaken.
Household Debt Service Payments as a Percent of Disposable Income
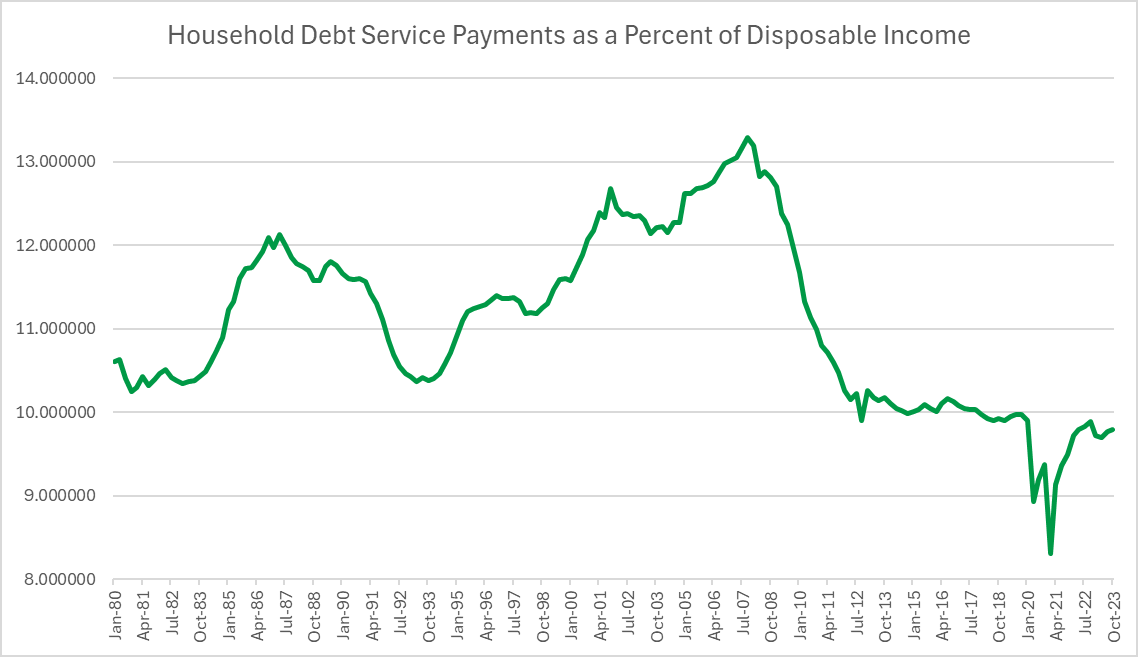
Source: Federal Reserve Bank of St. Louis. As of Q4 2023.
Yield Curve Remains Elevated
Hotter than expected inflation data during the 1H of 2024 caught the market off-guard as rate cut expectations were pushed until the end of 2024.
Coupled with expectations for continued deficit spending by the Treasury, longer dated yields have moved higher. However, expectations are growing for multiple rate cuts to be delivered by the end of 2024 as slack in the labor market grows.
US Treasury Yield Curve
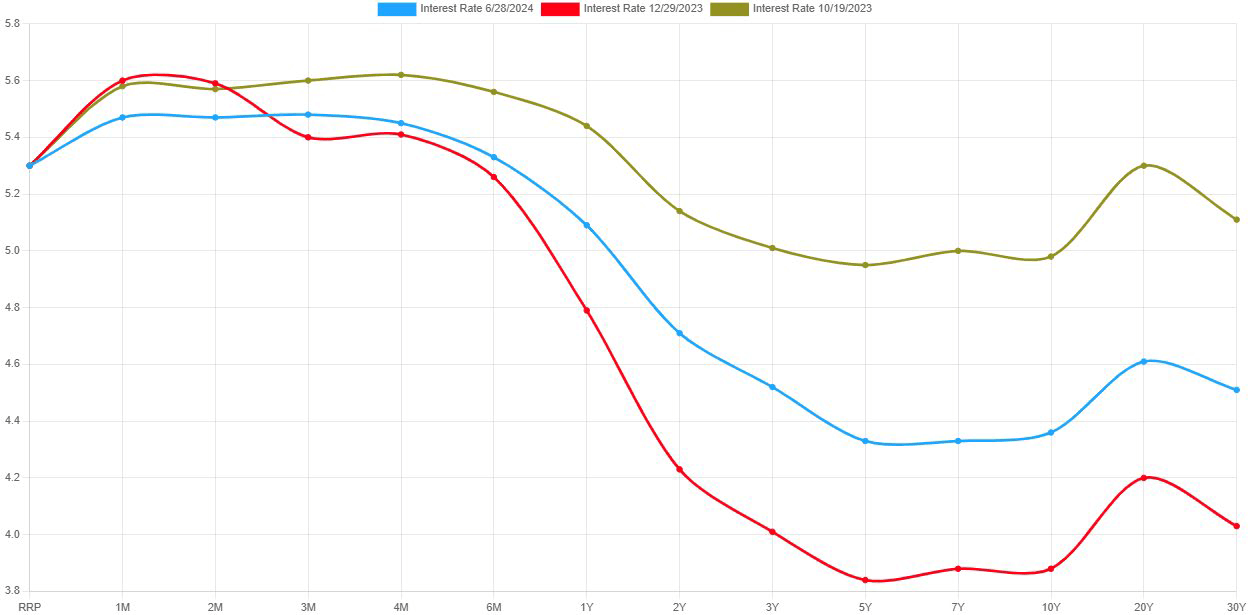
Source: ustreasuryyieldcurve.com
Credit Spreads Pull Tighter
The risk-on sentiment in markets couple with the high level of interest rates drove credit spreads to historically tight levels.
Investors are currently receiving low compensation to take additional credit risk, prompting a preference for higher-quality investments until spreads offer better risk-adjusted opportunities.
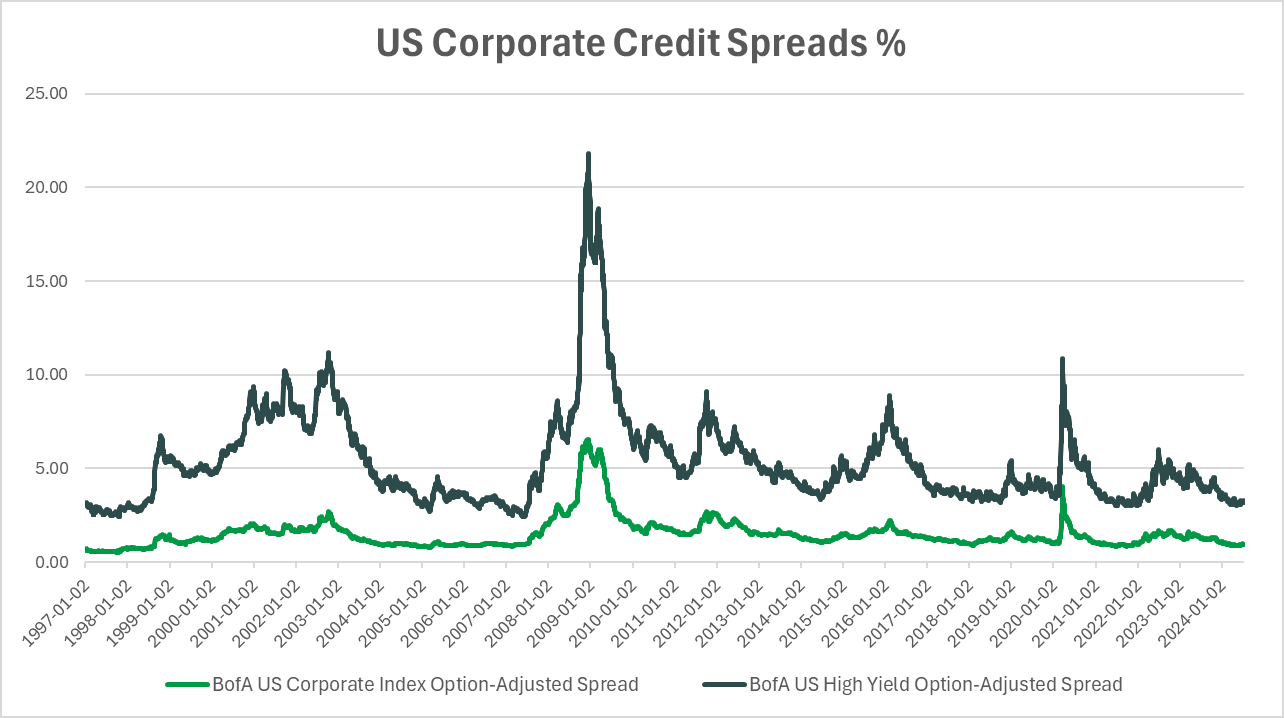
Source: Federal Reserve Bank of St. Louis, Ice Data Indices, LLC. As of 7/10/2024
Asset Class Analysis
Equities: Target-weight
Equity markets have continued to perform well this year, however the initial broadening of the rally at the start of 2024 reverted back to leadership by the mega-cap tech stocks. Outside of these large names, the rest of the market is more reasonably valued, but hasn’t garnered the attention of investors to drive stock appreciation to the same degree. Some of this is warranted, due to strong growth and pristine balance sheets of these tech companies in a high-rate environment, but as inflation cools and the Fed looks to eventually cut, we expect the rest of the market to catch up, given the benign economic backdrop. We continue to overweight domestic equities and maintain a large-cap orientation overall but complement these exposures with high quality smaller cap active allocations based on expectations for broadening market strength.
Fixed Income: Target-weight
The Fed will likely begin to cut rates this year, but the impact on longer-maturity bonds may be muted, barring a material slowdown in the economy. Thus, staying shorter-duration and picking up incremental returns from credit and securitized assets above treasuries can enhance income from this asset class. We barbell this allocation with high-income producing private credit and liquid investment grade bonds.
Liquid Alternatives: Target-weight
Hedge Funds: Hedge funds continue to serve as the diversifying asset class to traditional stocks and bonds. We continue to increase exposures to uncorrelated and macro strategies while culling more directional allocations.
Real Estate: The asset class has fallen out of favor with rising rates and looming debt maturities, despite their long-term inflation-aligned characteristics. Given depressed values, we are seeking opportunistic investment strategies in both debt and equity that can offer enhanced return potential without taking material risk.
Illiquid Alternatives: Target-weight
Fundamentals in private markets have improved, with M&A activity resurrecting (but still at depressed levels). As sponsors and businesses reevaluate opportunities in a higher, but stable interest rate environment, deal activity is picking up at the lower end of the market, but exits at the upper end are delayed. Secondary opportunities continue to remain attractive in the near-term, but long-term commitments to buy-out and venture should be highly accretive to returns over the next few years.
Disclaimer
The information, analysis, and opinions expressed herein are for general and educational purposes only. Nothing contained herein is intended to constitute legal, tax, accounting, securities, or investment advice nor an opinion regarding the appropriateness of any investment, nor a solicitation of any type.
Please remember that past performance may not be indicative of future results. Different types of investments involve varying degrees of risk, and there can be no assurance that the future performance of any specific investment, investment strategy, or product (including the investments and/or investment strategies recommended or undertaken by Simon Quick Advisors LLC), or any non-investment related content, made reference to directly or indirectly in this presentation will be profitable, equal any corresponding indicated historical performance level(s), be suitable for your portfolio or individual situation, or prove successful. Asset Allocation may be used in an effort to manage risk and enhance returns. It does not, however, guarantee a profit or protect against loss. Due to various factors, including changing market conditions and/or applicable laws, the content may no longer be reflective of current opinions or positions. Moreover, you should not assume that any discussion or information contained in this presentation serves as the receipt of, or as a substitute for, personalized investment advice from Simon Quick Advisors LLC. To the extent that a reader has any questions regarding the applicability of any specific issue discussed above to his/her individual situation, he/she is encouraged to consult with the professional advisor of his/her choosing. Investing in alternatives may not be suitable for all investors, and involves a high degree of risk. Many alternative investments are highly illiquid, meaning that you may not be able to sell your investment when you wish. Risk of alternative investments can vary based on the underlying strategies used.
Certain information contained herein may be “forward-looking” in nature. Due to various risks and uncertainties, actual events or results or the actual performance of the Fund may differ materially from those reflected or contemplated in such forward-looking information. As such, undue reliance should not be placed on such information. Forward-looking statements may be identified by the use of terminology including, but not limited to, “may,” “will,” “should,” “expect,” “anticipate,” “target,” “project,” “estimate,” “intend,” “continue” or “believe” or the negatives thereof or other variations thereon or comparable terminology.
Simon Quick Advisors LLC is neither a law firm nor a certified public accounting firm and no portion of the presentation content should be construed as legal or accounting advice. If you are a Simon Quick Advisors LLC client, please remember to contact Simon Quick Advisors LLC, in writing, if there are any changes in your personal/financial situation or investment objectives for the purpose of reviewing/evaluating/revising our previous recommendations and/or services. Simon Quick Advisors, LLC (Simon Quick) is an SEC registered investment adviser with a principal place of business in Morristown, NJ. Simon Quick may only transact business in states in which it is registered, or qualifies for an exemption or exclusion from registration requirements. A copy our written disclosure brochure discussing our advisory services and fees is available upon request. References to Simon Quick Advisors as being “registered” does not imply a certain level of education or expertise.
Historical performance results for investment indices and/or categories have been provided for general comparison purposes only, and generally do not reflect the deduction of transaction and/or custodial charges, the deduction of an investment management fee, nor the impact of taxes, the incurrence of which would have the effect of decreasing historical performance results. It should not be assumed that your account holdings correspond directly to any comparative indices. You cannot invest directly in an index.
Indices included in this report are for purposes of comparing your returns to the returns on a broad-based index of securities most comparable to the types of securities held in your account(s). Although your account(s) invest in securities that are generally similar in type to the related indices, the particular issuers, industry segments, geographic regions, and weighting of investments in your account do not necessarily track the index. The indices assume reinvestment of dividends and do not reflect deduction of any fees or expenses.
Please Note: (1) performance results do not reflect the impact of taxes; (2) It should not be assumed that account holdings will correspond directly to any comparative benchmark index; and, (3) comparative indices may be more or less volatile than your account holdings.
Please note: Indices are frequently updated and the returns on any given day may differ from those presented in this document
Economic, index, and performance information is obtained from various third party sources. While we believe these sources to be reliable Simon Quick Advisors LLC has not independently verified the accuracy of this information and makes no representation regarding the accuracy or completeness of information provided herein.
As of April 1st, 2022, Simon Quick Advisors LLC has changed private capital index providers from Cambridge Associates to Pitchbook Benchmarks.