
After a painful year of negative equity & fixed income returns in 2022, markets have experienced a strong rally thus far in 2023. The S&P 500 advanced over 16% during the first half of the year as hype surrounding advances in Artificial Intelligence (‘AI’) led to significant gains for technology-oriented businesses, helping to offset negative sentiment driven by regional bank runs. Whether this is a bear market rally or the start of a new bull market for equities has become a popular debate, with the bulls so far winning the argument. However, the risks of tighter financial conditions, continued regional banking stresses driven by commercial real estate troubles, and sticky inflation causing a higher for longer stance from the Fed remain apparent.
While the S&P has seen strong headline performance, the underlying drivers of this performance appear far less robust. The vast majority of market performance has been generated by a subset of 8 megacap & technology-oriented stocks while the remaining 490+ names in the index have seen much more muted performance. This is highlighted by the divergence in performance of the S&P market-cap weighted index (of which these names comprise nearly 30%) which returned over 16% and the equal weighted index that returned just over 6%. The dramatic outperformance from this subset of names had led to the S&P trading at a forward PE of 19x, with the megacap-8 trading at a multiple of 31.0x compared to 16.5x for the remainder of the index. In order for this equity rally to continue its momentum, a widening of market breadth into the small cap & value sectors may be needed.
Despite repeated calls for an impending recession in the United States, economic activity has stayed resilient throughout the first half of the year. Broad based economic data has strongly beat expectations in the US, highlighted by continuing decreases in headline inflation, Q1 real GDP growing at a 2% annualized rate, the unemployment rate remaining below 4%, and a strong recovery in housing activity despite elevated mortgage rates. On the other hand, economic activity has been much more disappointing in Europe & Asia, and inflation in the Eurozone has proven much stickier. This has been a driver of strong domestic outperformance vs the international developed & emerging markets, with the MSCI EAFE Index up 12% and MSCI EM Index up just 5%.
Fixed Income markets have seen positive performance in 2023 as well despite underperforming equity markets. After seeing a strong drop in yields following the regional banking volatility in March, longer-dated yields have moved back to pre-SVB levels as bank deposits recovered and resilient economic activity has forced the Fed to continue hiking rates. A lack of weakness in labor markets may force the Fed to keep their foot on the brakes, potentially raising the possibility of a hard landing if tighter financial conditions continue to weigh on the global economy.
Market Overview
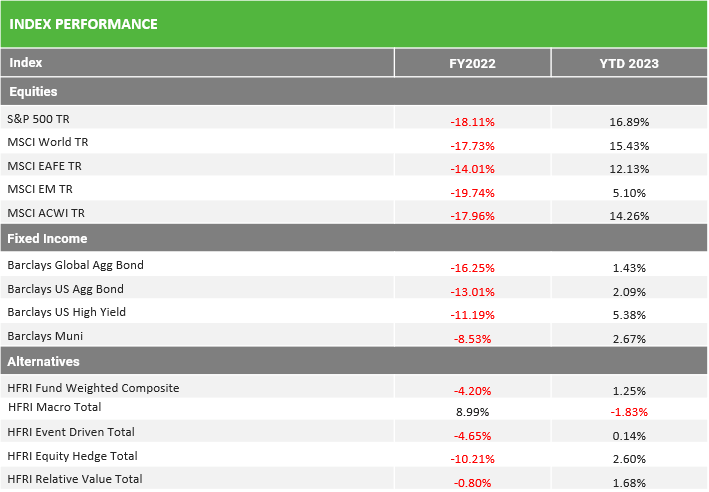
Source: Bloomberg Barclays, MSCI; FY2022 as of 12/31/2022.. For Equities & Fixed Income, YTD 2023 as of 6/30/2023. For Alternatives, YTD 2023 as of 5/31/2023.
Equity markets have seen a strong recovery in 2023, led by domestic megacap companies with exposure to the adoption of Artificial Intelligence technology. Domestic indices have led global and international markets due to a higher concentration of tech companies that saw extremely strong performance. In addition, the US economy is proving to be far more resilient than their European and Asian peers, helping to drive outperformance. Fixed Income markets also saw a recovery to start 2023 but to a much lesser extent than equities. The continued strength of the US economy has led the market to price in higher Fed Fund rates and delayed the expectation for rate cuts, partially negating the income generation from the sector.

Source: Bloomberg; FY2022 as of 12/31/2022;. YTD 2023 as of 6/30/2023.
The sector winners of 2023 continue to be those most beaten down in 2022; the growth-oriented sectors of IT, Consumer Discretionary, and Communication Services. While the prospects of rate cuts have not yet materialized, these sectors have benefited from their exposure to the adoption of Artificial Intelligence with the 8 biggest names in the S&P seeing some of the strongest performance to start 2023.
U.S Equity Style & Market Capitalization Returns
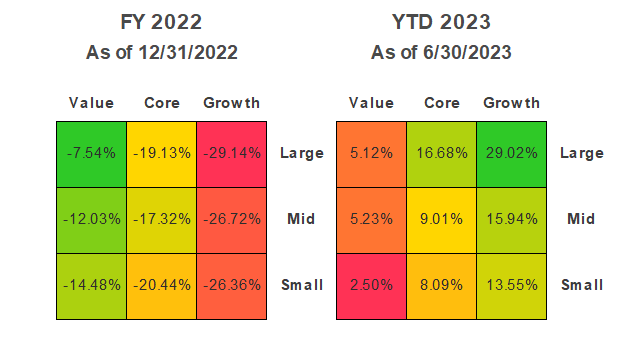
Source: Bloomberg; FY 2022 as of 12/31/2022. YTD as of 6/30/2023.
Unsurprisingly given the hype surrounding AI, large-cap growth has been the strongest performer YTD in 2023 and has driven headline index performance. Mid and Small Cap growth stocks have also performed well, while the value style has lagged. Cyclical and small-cap equities have lagged in 2023 as a flight to quality has led to investors avoiding exposure that could be impacted in an economic slowdown. Regional banks have had an outsize impact on the Small and Midcap value space as bank failures drove investors to avoid the industry.
Equity Market Dispersion
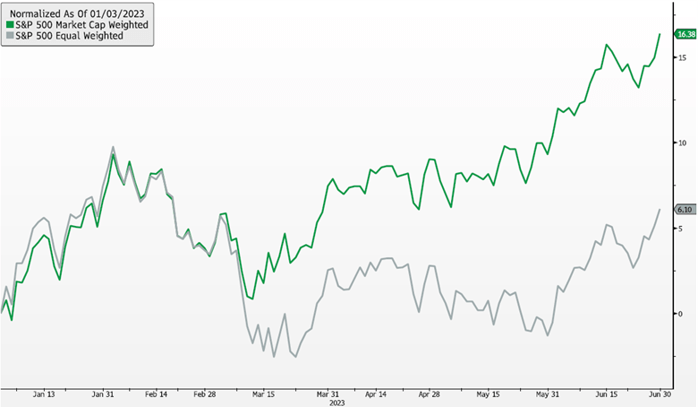
Source: Bloomberg
The S&P 500 has had a strong start to the year, but this performance has not been widespread. Following the collapse of Silicon Valley Bank in March, a significant divergence has emerged between the market cap and equal-weighted indices. The 8 largest contributors to the S&P’s performance (listed on the next page) drove over 73% of the gains despite comprising less than 25% of the index, causing the major divergence above.
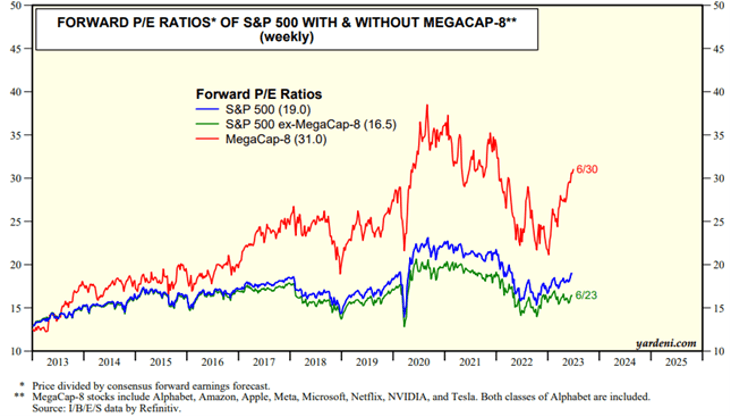
Source: Yardeni Research
The strong performance of the S&P has led the index to trade at a forward PE multiple of 19x, above the long-term average of 16.5x but below the levels seen in 2020 and 2021. However, this move higher has been concentrated in the 8 largest names in the index that trade at a 31x multiple. Exclusive of these 8 megacap names, the S&P’s forward PE ratio is 16.5x. While the broader markets’ valuation looks more attractive, these stocks are typically less resilient and more cyclically sensitive than the megacap names that have driven index performance.
Inflation Continues to Move off Highs
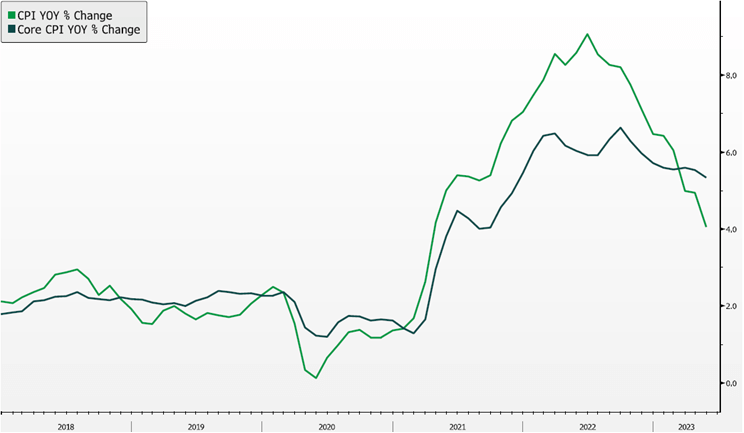
Source: Bloomberg
Turning to economic data, the Fed remains focused on its fight against inflation. Headline inflation has continued to move strongly off of the highs set in 2022, driven in large part by decreasing energy & goods prices. However, core inflation is proving to be much more stubborn. Bolstered by resilient service spending and shelter costs, core inflation remains above 5%. While market participants have consistently referenced the lagged nature of shelter costs in core CPI, surprisingly resilient housing & labor markets may keep this figure elevated for longer than expected.
US Economic Resiliency
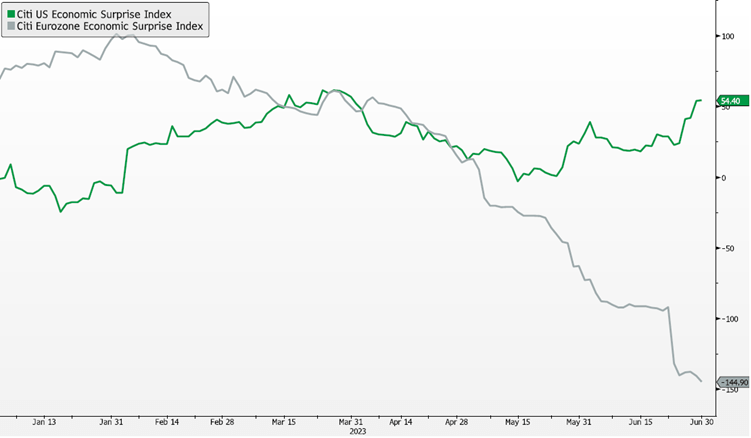
Source: Bloomberg
In addition to labor & inflation, broad-based economic data has strongly beaten expectations in the US, as highlighted by the Citi Economic Surprise Index. A much stronger than expected Q1 GDP print, recovering housing data, and resilient manufacturing & service activity has continued to drive a resilient US economy.
On the other hand, international economies have seen much weaker economic data. After benefiting tremendously from a warmer-than-expected winter, European economies have seen strong misses on data readouts including elevated inflation and weak manufacturing activity. A weak Chinese recovery has added to the data misses from European economies that rely on exports to the country.
Moves in the Treasury Curve
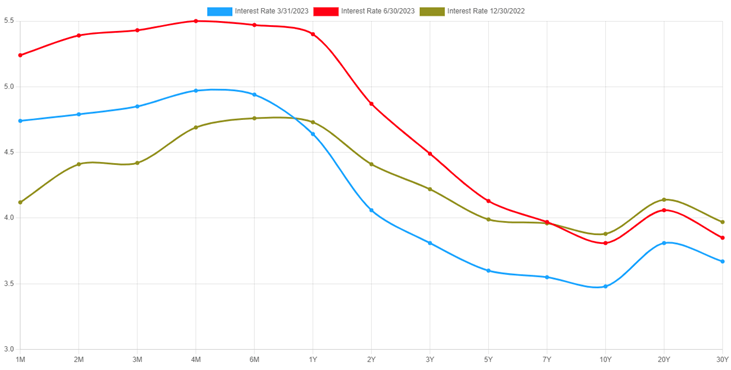
Source: ustreasuryyieldcurve.com
The resiliency in US economic activity has led to an expectation for additional rate hikes from the Federal Reserve relative to the end of 2022 in order to quell inflation. These expectations can be seen by the strong move higher in the front end of the treasury curve. The longer end of the treasury curve has moved higher in recent months as well, reversing the move lower in March following the regional banking stresses. Long-term inflation expectations remain well anchored, but attention will continue to be paid to longer-dated yields.
Asset Class Analysis
Equities: Under-weight
The strong rally in the first half of 2023 has put the S&P500 at about 7 percent off its late 2021 highs, recovering from its 18% loss last year. This performance came despite material bank pressures and still rising rates, as consumer spending more than offset these challenges. However, businesses continue to get more defensive as liquidity and credit availability have deteriorated. A recession may be on the horizon, but even without leaning into that possibility, we think higher valuations, declining capex by businesses, and slowing spend by consumers will be headwinds to further market appreciation and thus think it opportune to take these early gains and diversify into more defensive, income-producing assets to create resiliency in portfolios.
We reiterate that high valuations do not leave enough margin for error, notably as interest rates will likely remain high, thus the hurdle for riskier investments is also higher.
Value versus Growth: We maintain a relatively balanced approach to Value versus Growth styles, but with a slight bias to Defensive portfolios that are only modestly cheaper than their core benchmark but exhibit greater business resiliency. These managers would be more protective in a market sell-off, but lag in a market rally.
Large versus Small: We complement our Large Cap Defensive exposure with selective, active small- and mid-cap funds. Small caps tend to be more economically sensitive, so we look to be more valuation-conscious in this segment.
Domestic versus International: We maintain an overweight to Domestic stocks, based on the quality of businesses and depth of capital markets in the US. We have modestly reduced that overweighting with the addition of a Defensive International strategy. We are modestly underweight Emerging Markets.
Fixed Income: Over-weight
We are Over-weight fixed income via a barbelled approach of investment grade bonds (for some income generation but to also serve as an equity market hedge) and floating rate credit (with attractive income distribution in a higher rate environment and still benign default experience) to complement and diversify away from stocks. The traditional fixed income allocation is highly liquid and can be quickly reinvested into other opportunities that may present themselves in a more challenged market. Floating rate debt exposure is currently offering equity-like return potential while moving up in capital structure seniority and reducing overall portfolio volatility versus equities.
Interest Rate Sensitivity: We had extended our duration as the Fed raised rates throughout 2022. We may have another 25-50bps in hikes coming in 2023, but believe a 5%+ interest rate environment can easily absorb them without suffering material impact to performance. Additionally, if a recession were to come sooner and more severe than anticipated, rate cuts would follow, which would be most beneficial to longer-term bonds. The inverted yield curve makes it challenging to buy 4% 10-year bonds, versus 5%+ 1-year debt, however floating rate and investment grade credit spreads more than compensate for that difference.
Credit Quality: We seek to maintain an overall investment grade credit quality in our liquid fixed income exposures, however would balance this positioning with illiquid direct lending and structured credit investments that exhibit strong equity-like returns despite lower volatility. We are currently limiting this high yield exposure to alternative credit strategies and private investment opportunities that are less sensitive to daily flows and mark-to-market variability.
Liquid Alternatives: Target-weight
Hedge Funds: Under the surface of strong performance from the megacap equities is greater volatility and opportunities for price discovery across asset classes, particularly smaller stocks and credit. This is creating a ripe opportunity for diversified and long/short hedge funds. Strategies that can take advantage of short-term pricing dislocations can offer return enhancement and better resiliency to bouts of volatility. We are exploring specialized lending opportunities that are complementary to traditional direct lending while diversifying away business cycle risk.
Real Estate: We have been adding core-plus real estate opportunities, notably in residential assets for its inflation aligned properties and as a complement to stock and bond portfolios.
Illiquid Alternatives: Target-weight
Valuations adjusted lower, following public market declines in 2022. Committed capital for opportunistic deployment over the next few years should make this vintage of fundraises highly attractive.
Secondaries and Distressed investing strategies may benefit well from a slowing economy as they tend to be opportunistic buyers of good assets at discounted valuations, during a period of market uncertainty. The next couple years may be an attractive time to be an opportunistic buyer of real estate assets that may be unsold or facing refinancing pressures. We are diligencing cross-asset special situations strategies in a drawdown format that can take advantage of illiquidity induced volatility.
DISCLAIMER
The information, analysis, and opinions expressed herein are for general and educational purposes only. Nothing contained herein is intended to constitute legal, tax, accounting, securities, or investment advice nor an opinion regarding the appropriateness of any investment, nor a solicitation of any type.
Please remember that past performance may not be indicative of future results. Different types of investments involve varying degrees of risk, and there can be no assurance that the future performance of any specific investment, investment strategy, or product (including the investments and/or investment strategies recommended or undertaken by Simon Quick Advisors LLC), or any non-investment related content, made reference to directly or indirectly in this presentation will be profitable, equal any corresponding indicated historical performance level(s), be suitable for your portfolio or individual situation, or prove successful. Asset Allocation may be used in an effort to manage risk and enhance returns. It does not, however, guarantee a profit or protect against loss. Due to various factors, including changing market conditions and/or applicable laws, the content may no longer be reflective of current opinions or positions. Moreover, you should not assume that any discussion or information contained in this presentation serves as the receipt of, or as a substitute for, personalized investment advice from Simon Quick Advisors LLC. To the extent that a reader has any questions regarding the applicability of any specific issue discussed above to his/her individual situation, he/she is encouraged to consult with the professional advisor of his/her choosing. Investing in alternatives may not be suitable for all investors, and involves a high degree of risk. Many alternative investments are highly illiquid, meaning that you may not be able to sell your investment when you wish. Risk of alternative investments can vary based on the underlying strategies used.
Certain information contained herein may be “forward-looking” in nature. Due to various risks and uncertainties, actual events or results or the actual performance of the Fund may differ materially from those reflected or contemplated in such forward-looking information. As such, undue reliance should not be placed on such information. Forward-looking statements may be identified by the use of terminology including, but not limited to, “may,” “will,” “should,” “expect,” “anticipate,” “target,” “project,” “estimate,” “intend,” “continue” or “believe” or the negatives thereof or other variations thereon or comparable terminology.
Simon Quick Advisors LLC is neither a law firm nor a certified public accounting firm and no portion of the presentation content should be construed as legal or accounting advice. If you are a Simon Quick Advisors LLC client, please remember to contact Simon Quick Advisors LLC, in writing, if there are any changes in your personal/financial situation or investment objectives for the purpose of reviewing/evaluating/revising our previous recommendations and/or services. Simon Quick Advisors, LLC (Simon Quick) is an SEC registered investment adviser with a principal place of business in Morristown, NJ. Simon Quick may only transact business in states in which it is registered, or qualifies for an exemption or exclusion from registration requirements. A copy our written disclosure brochure discussing our advisory services and fees is available upon request. References to Simon Quick Advisors as being “registered” does not imply a certain level of education or expertise.
Historical performance results for investment indices and/or categories have been provided for general comparison purposes only, and generally do not reflect the deduction of transaction and/or custodial charges, the deduction of an investment management fee, nor the impact of taxes, the incurrence of which would have the effect of decreasing historical performance results. It should not be assumed that your account holdings correspond directly to any comparative indices. You cannot invest directly in an index.
Indices included in this report are for purposes of comparing your returns to the returns on a broad-based index of securities most comparable to the types of securities held in your account(s). Although your account(s) invest in securities that are generally similar in type to the related indices, the particular issuers, industry segments, geographic regions, and weighting of investments in your account do not necessarily track the index. The indices assume reinvestment of dividends and do not reflect deduction of any fees or expenses.
Please Note: (1) performance results do not reflect the impact of taxes; (2) It should not be assumed that account holdings will correspond directly to any comparative benchmark index; and, (3) comparative indices may be more or less volatile than your account holdings.
Please note: Indices are frequently updated and the returns on any given day may differ from those presented in this document
Economic, index, and performance information is obtained from various third party sources. While we believe these sources to be reliable Simon Quick Advisors LLC has not independently verified the accuracy of this information and makes no representation regarding the accuracy or completeness of information provided herein.
As of April 1st, 2022, Simon Quick Advisors LLC has changed private capital index providers from Cambridge Associates to Pitchbook Benchmarks.