After a period of positive performance for financial markets through the first half of 2023, both equities and traditional fixed income experienced a modest quarter of negative performance in Q3. The S&P 500 declined over 3.2% while the Bloomberg Barclays Agg Bond index similarly detracted 3.2% during Q3. The bulk of this weakness occurred during September as rapidly increasing treasury yields sent bond prices lower and spooked equity markets.
On the year, headline index performance remains strong with the S&P 500 up over 13% through Q3. While this has been a healthy period of recovery after the painful period of 2022, there has been tremendous dispersion across global equities with index-level performance belying the muted performance of the broader stock market. As has been widely discussed, the S&P 500’s performance has been driven by a handful of megacap technology or growth-oriented stocks that comprise nearly 30% of the index. Driven in large part by the hype surrounding advances in artificial intelligence, this group of stocks, known as the Magnificent 7 (or Megacap 8), have driven over 80% of the index’s performance (note, we will use the terms Magnificent 7 or Megacap 8 to describe the same 7 companies or 8 stocks with both share classes of Alphabet being included). The remaining constituents in the S&P 500, along with small caps, international, and emerging market stocks, have seen much more muted performance.
Valuations on the S&P 500 remain well off their peaks set in 2021, and below the highs seen in 2023, but continue to remain above long-term historical averages. However, the Magnificent 7 are largely driving these elevated price-to-earnings ratios. These 7 companies trade at a forward PE ratio over 26x vs. the broader index closer to 18x. Stripping out these 7 companies, the remaining 490+ constituents trade at much more reasonable levels around 16x. While these companies appear expensive to the broader market & on a historical basis, there may be some validity to these valuation premiums given the high-quality nature of the businesses & balance sheets in this group. Expectations for strong earnings growth in 2024 (12+%) are already priced into equities, giving a high hurdle to meeting these already lofty valuations.
Further pressuring valuations for equities have been the material move higher in global yields experienced in Q3. Despite inflation continuing to come off recent highs & the Fed currently pausing on further rate hikes, longer-dated treasury yields have moved significantly higher in recent months. From the end of June through September, yields on the 10-year US Treasury increased close to 100 basis points. Continued economic resiliency, a higher-for-longer stance from the Fed regarding interest rates, higher oil prices, and higher-than-expected issuance from the US Treasury have all contributed to this increase in yields.
The downward move in the price of oil through the 1st half of 2023 was a major contributor to the decline in headline inflation as CPI fell to 3% in June. Since this time, we have seen a gradual increase in year-over-year headline inflation with headline CPI back over 3.6% in August. Core CPI continued its downward trend however and reached 4.4% in August. Inflation continues to remain above the Fed’s target while labor markets remain tight, limiting the central bank’s ability to ease policy rates in the near future.
Market Overview
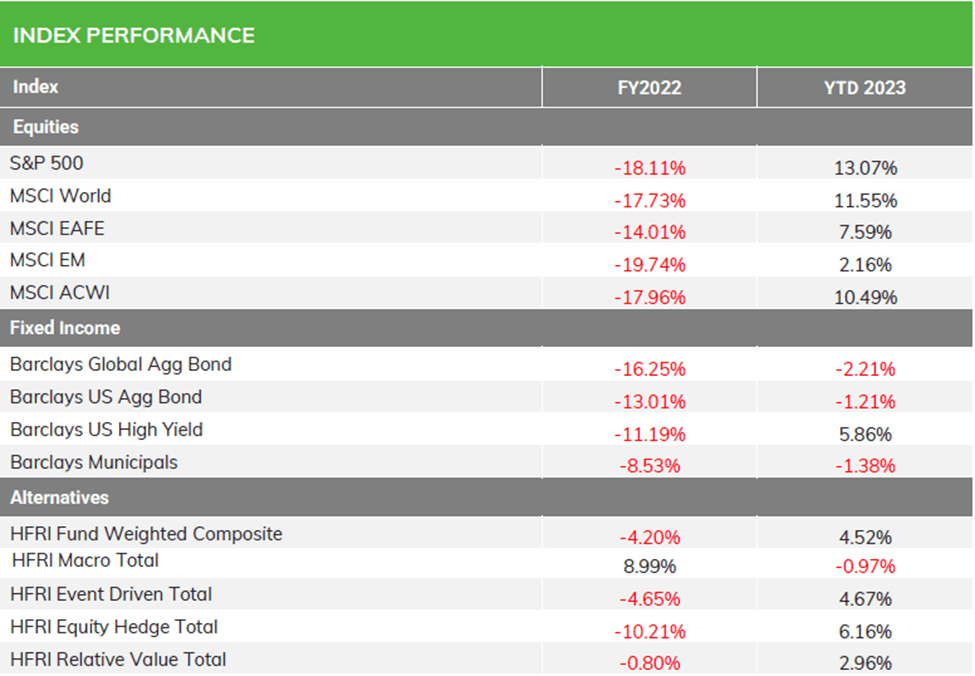
Source: Bloomberg Barclays, MSCI; FY2022 as of 12/31/2022. For Equities & Fixed Income YTD 2023 as of 9/30/2023. For Alternatives, YTD 2023 as of 8/31/2023.
Equity markets continue to maintain strong performance on the year with a select few megacap technology names driving performance. Domestic equity markets, in which these few names comprise a large portion of the indices, have generated significant outperformance versus both international & emerging markets.
After a strong start to the year, fixed income performance has turned negative for 2023. A higher-for-longer stance from the Fed & other central banks have pushed longer-dated yields higher, driving negative performance for duration sensitive investments. High yield & floating rate fixed income investments have strongly outperformed traditional fixed income as spreads have remained tight & high coupons have offset rising rates.
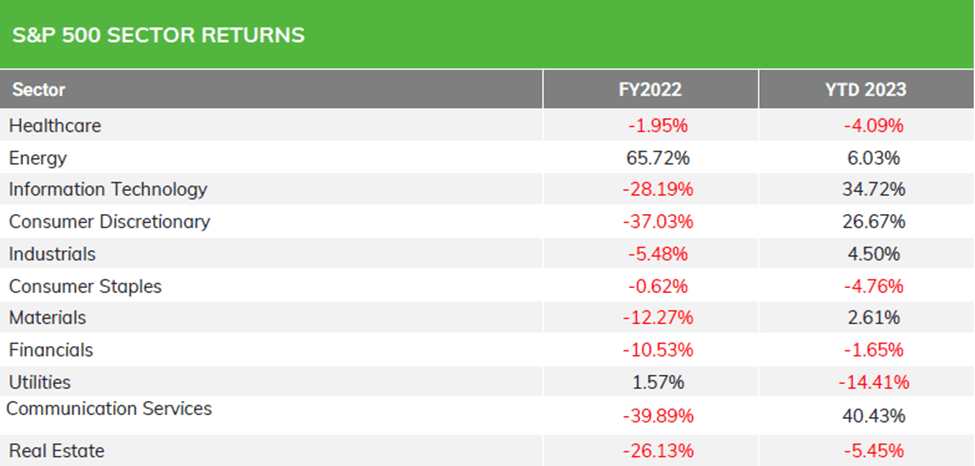
Source: Bloomberg; FY2022 as of 12/31/2022;. YTD 2023 as of 9/30/2023.
The YTD sector outperformers continue to be those with the most exposure to the megacap names that have driven this rally: Info Tech, Consumer Discretionary, & Communication Services. Both of the more traditional defensive sectors (Utilities, Staples, Real Estate) & cyclical sectors (Energy, Industrials, Materials, Financials) have lagged this rally significantly.
U.S Equity Style & Market Capitalization Returns
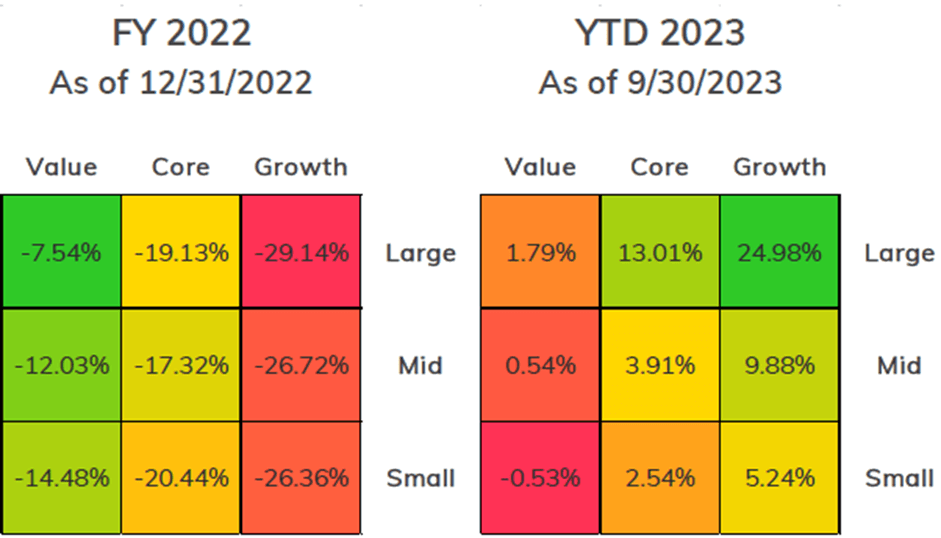
Source: Bloomberg; FY 2022 as of 12/31/2022. YTD as of 9/30/2023.
Given the high level of exposure to AI linked companies and the megacap names that have driven 2023 equity markets, large cap growth has been a strong outperformer this year. Outside of this area of the market, returns have been much more muted.
Small caps have been unrewarded in this market rally due in large part to tighter financing conditions in a world of higher rates that tend to impact smaller companies’ bottom lines more significantly than their large cap peers.
Equity Market Dispersion

Despite the strong headline performance for equity markets in 2023, only a small subset of stocks have participated in this rally. Through Q3, 80+% of the S&P returns have been driven by the Megacap 8, while the broader equity universe is generally flat as highlighted by the S&P Equal Weight.
Not only have small caps lagged, but even other high quality megacap companies that make up the Dow Jones Industrial Average have seen muted performance. While prior equity bull markets have seen a similar dynamic of concentrated leadership in the early stages, a broadening out of market participants may be needed for this rally to continue.

Source: Yardeni Research
While significantly below the highs set during the post-COVID rally, the S&P trades at fairly rich valuations based on forward earnings given the uncertain macro backdrop. In particular, the Megacap 8 that has driven this rally trade at a significant premium to the remainder of the S&P, despite valuations moving lower in recent months.
Baked into these forecasts include an expectation for strong earnings in 2024. Analyst consensus at the end of Q3 forecasts a 12+% year-over-year increase in earnings for 2024. This high bar adds additional concerns to the valuations priced into markets.

Source: ustreasuryyieldcurve.com
Despite a Fed that has paused its hiking campaign, long dated treasury yields have moved aggressively higher over recent months. This move is causing fixed income performance to turn negative once again and has pressured equities as well as market participants to adjust to a ‘Higher-for-Longer’ stance from the Fed.
Resilient economic data, hawkish Fed commentary, increased issuance from the Treasury, and weak demand from foreign buyers have all contributed to this rise in long dated yields. Close attention will be paid to go-forward inflation expectations and Central Bank responses to increased global yields.
US Dollar & Oil Resume Upward Climbs
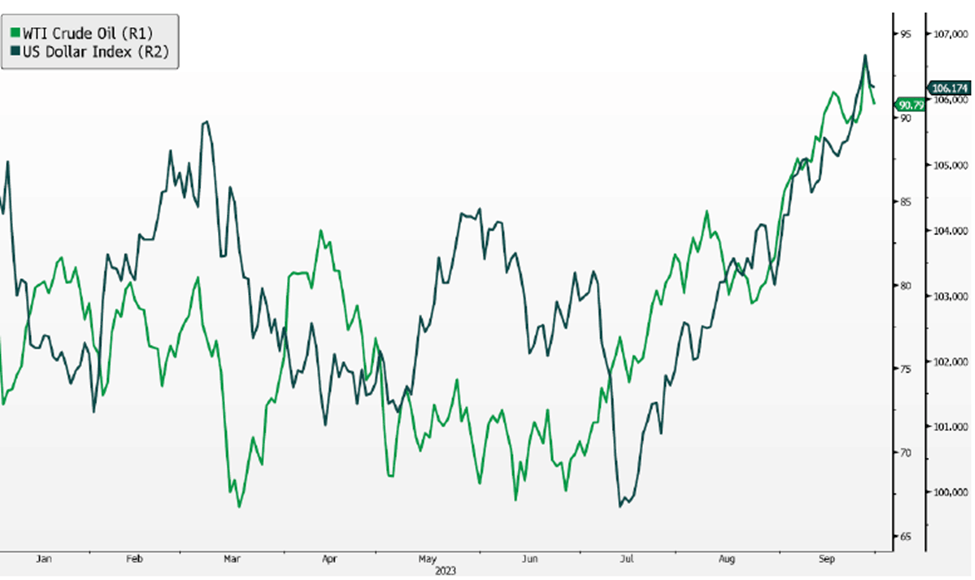
In addition to rising long-term yields, there has been a resurgence in the price of oil and the US Dollar in recent months. The strength of the US Dollar has been largely tied to the Fed’s higher-for-longer stance & the economic resiliency shown in 2023. Oil has been similarly undisrupted from a demand perspective, and tight inventories along with OPEC cutting production have sent prices higher once again.
As two globally important assets, the increases in prices of the US Dollar and oil, along with the move higher in rates, serve to further tighten financial conditions. Close attention will be paid to the second-hand effects of these moves by Central Bankers and market participants.
Inflation Continues to Move off Highs
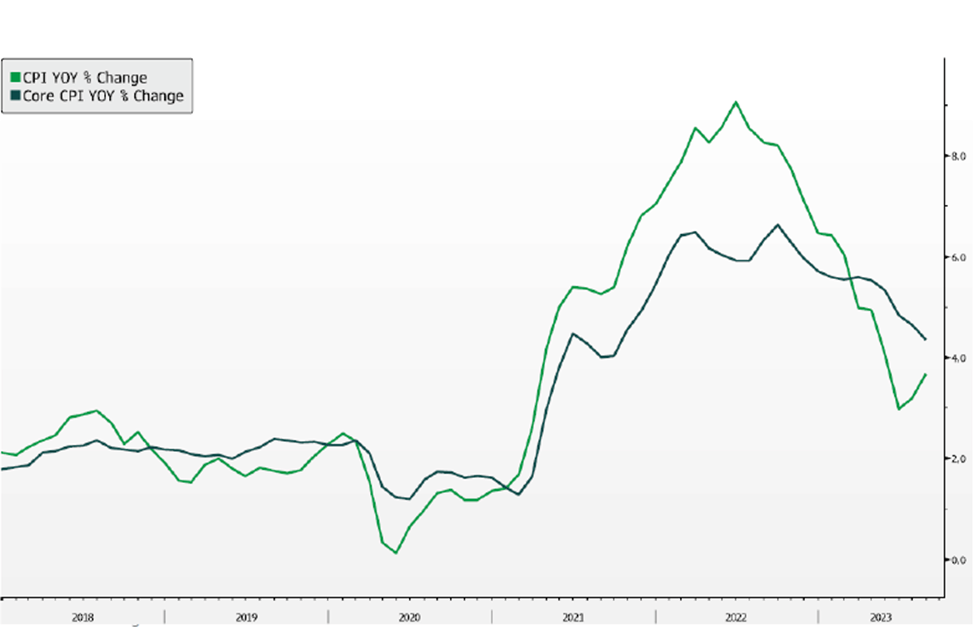
Inflation continues to remain a focus for investors as both Headline and Core CPI remain elevated to the Fed’s targets. Core CPI has continued to moderate gradually over recent months, hitting levels not seen since late 2021. Elevated shelter prices continue to keep this figure elevated but have begun to moderate in recent months.
Headline CPI, after hitting a low below 3% in July, has begun to move higher again as the recent declines in food & energy prices have begun to reverse. Base effects that helped to keep inflation elevated in the first half of the year are also reversing and may cause CPI to remain elevated through year-end.
Employment Remains Resilient
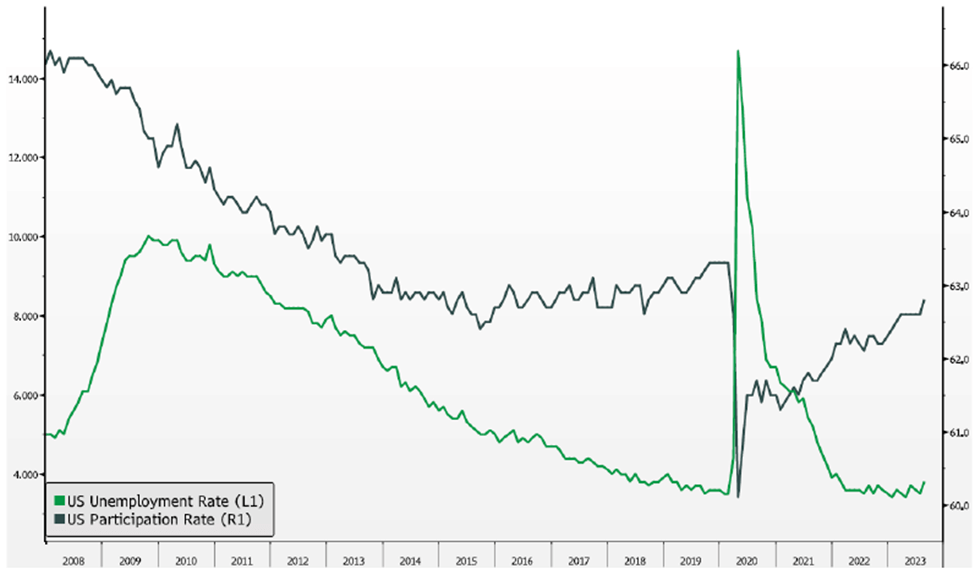
Labor markets continue to remain tight, with the unemployment rate remaining near all-time lows and wage growth remaining elevated. On a positive note, the labor force participation rate has moved steadily higher but remains well below pre-COVID levels as the 55+ age cohort has not returned to the labor force due to a wave of early retirements.
The tightness in labor markets, exemplified by multiple ongoing union strikes and negotiations, coupled with the renewed increase in inflation keeps the Fed in a tough position as they remain data dependent.
Asset Class Analysis
Equities: Under-weight
After a strong showing in the first half of the year, equities melted down over the summer, as acquiescing to “higher-for-longer” rates shook investor confidence for a soft landing. The Fed is forcing an economic deceleration and almost all but the “Magnificent 7” stocks are feeling it. The S&P500 excluding Apple, Amazon, Google, Meta, Microsoft, Nvidia and Tesla, is up less than 2% on the year. Small caps are actually faring slightly better than that at 2.5%, but both measures are uninspiring, particularly in contrast to yields available in fixed income securities today. Third quarter earnings and guidance will likely set the tone for corporate confidence for the remainder of the year. We anticipate continued volatility, especially as the geopolitical outlook gets dimmer with renewed conflict in the Middle East. We remain focused on quality and value but recognize that those two don’t always come in one package, resulting in lighter exposure to the asset class.
Value versus Growth: We maintain a relatively balanced approach to Value versus Growth styles, but with a slight bias to Defensive portfolios that exhibit greater resiliency in economic weakness. These managers would be more protective in a market sell-off, but lag in a market rally.
Large versus Small: We complement our Large Cap Defensive exposure with selective, active small- and mid-cap funds. Small caps tend to be more economically sensitive, so we look to be more valuation-conscious in this segment.
Domestic versus International: We maintain an overweight to Domestic stocks, based on the quality of businesses and depth of capital markets in the US. We lean towards Quality/Growth stocks in Developed Markets and are modestly underweight Emerging Markets.
Fixed Income: Over-weight
The third quarter was difficult for bonds as well. While the Fed is on pause on short-term rates, longer-term yields spiked in August, pushing the Barclays US Aggregate index negative on the year. Despite this volatility, we remain over-weight fixed income via a barbelled approach of intermediate-term investment grade bonds (for some income generation but to also serve as an equity market hedge) and floating rate high yield credit (with attractive income distribution in a higher rate environment and still benign default experience) to complement and diversify away from stocks.
Interest Rate Sensitivity: The market has accepted higher rates on the front-end but is also now raising those expectations for longer-dated bonds. While this has created some bond market volatility, it affords investors the chance to lock in yields several points above the Fed’s long-term inflation and interest rate targets beyond the next couple years. As the Fed eventually brings interest rates down, these longer duration assets can amplify returns versus shorter-duration instruments.
Credit Quality: We seek to maintain an overall investment grade credit quality in our liquid fixed income exposures, however, are balancing this positioning with illiquid direct lending and structured credit investments that exhibit strong equity-like returns with lower volatility. We are currently limiting this high yield exposure to alternative credit strategies and private investment opportunities that are less sensitive to daily flows and mark-to-market variability.
Liquid Alternatives: Target-weight
Hedge Funds: A hawkish Fed, balance sheet run-off, and reduced demand for US Treasuries, has created volatility in both equity and fixed income markets. We think this provides an attractive opportunity for alternatives. Diversified and long/short hedge fund strategies can take advantage of short-term pricing dislocations to generate returns that are complementary to traditional asset classes and offer better resiliency to bouts of volatility. We recently added a short-duration specialty lending strategy that complements traditional direct lending and are currently evaluating relative value trading strategies.
Real Estate: We have been adding core-plus real estate opportunities, notably in residential assets for its inflation aligned characteristics and as a complement to stock and bond portfolios. These allocations are typically to assets purchased during the current rate hiking cycle at more attractive valuations than those purchased prior to 2022.
Illiquid Alternatives: Target-weight
Private business valuations have adjusted lower following public market declines in 2022. With more attractive pricing, capital deployed over the next few years should make this vintage of funds highly attractive.
Secondaries and Distressed investing strategies may particularly benefit well from a slowing economy as they tend to be buyers of good assets at discounted valuations during periods of market uncertainty. The next couple years may be an attractive time to be an opportunistic buyer of real estate assets that may be unsold or facing refinancing pressures. We recently published a paper on the opportunity in secondaries investing, which can be found on our website.
Disclaimer
The information, analysis, and opinions expressed herein are for general and educational purposes only. Nothing contained herein is intended to constitute legal, tax, accounting, securities, or investment advice nor an opinion regarding the appropriateness of any investment, nor a solicitation of any type.
Please remember that past performance may not be indicative of future results. Different types of investments involve varying degrees of risk, and there can be no assurance that the future performance of any specific investment, investment strategy, or product (including the investments and/or investment strategies recommended or undertaken by Simon Quick Advisors LLC), or any non-investment related content, made reference to directly or indirectly in this presentation will be profitable, equal any corresponding indicated historical performance level(s), be suitable for your portfolio or individual situation, or prove successful. Asset Allocation may be used in an effort to manage risk and enhance returns. It does not, however, guarantee a profit or protect against loss. Due to various factors, including changing market conditions and/or applicable laws, the content may no longer be reflective of current opinions or positions. Moreover, you should not assume that any discussion or information contained in this presentation serves as the receipt of, or as a substitute for, personalized investment advice from Simon Quick Advisors LLC. To the extent that a reader has any questions regarding the applicability of any specific issue discussed above to his/her individual situation, he/she is encouraged to consult with the professional advisor of his/her choosing. Investing in alternatives may not be suitable for all investors, and involves a high degree of risk. Many alternative investments are highly illiquid, meaning that you may not be able to sell your investment when you wish. Risk of alternative investments can vary based on the underlying strategies used.
Certain information contained herein may be “forward-looking” in nature. Due to various risks and uncertainties, actual events or results or the actual performance of the Fund may differ materially from those reflected or contemplated in such forward-looking information. As such, undue reliance should not be placed on such information. Forward-looking statements may be identified by the use of terminology including, but not limited to, “may,” “will,” “should,” “expect,” “anticipate,” “target,” “project,” “estimate,” “intend,” “continue” or “believe” or the negatives thereof or other variations thereon or comparable terminology.
Simon Quick Advisors LLC is neither a law firm nor a certified public accounting firm and no portion of the presentation content should be construed as legal or accounting advice. If you are a Simon Quick Advisors LLC client, please remember to contact Simon Quick Advisors LLC, in writing, if there are any changes in your personal/financial situation or investment objectives for the purpose of reviewing/evaluating/revising our previous recommendations and/or services. Simon Quick Advisors, LLC (Simon Quick) is an SEC registered investment adviser with a principal place of business in Morristown, NJ. Simon Quick may only transact business in states in which it is registered, or qualifies for an exemption or exclusion from registration requirements. A copy our written disclosure brochure discussing our advisory services and fees is available upon request. References to Simon Quick Advisors as being “registered” does not imply a certain level of education or expertise.
Historical performance results for investment indices and/or categories have been provided for general comparison purposes only, and generally do not reflect the deduction of transaction and/or custodial charges, the deduction of an investment management fee, nor the impact of taxes, the incurrence of which would have the effect of decreasing historical performance results. It should not be assumed that your account holdings correspond directly to any comparative indices. You cannot invest directly in an index.
Indices included in this report are for purposes of comparing your returns to the returns on a broad-based index of securities most comparable to the types of securities held in your account(s). Although your account(s) invest in securities that are generally similar in type to the related indices, the particular issuers, industry segments, geographic regions, and weighting of investments in your account do not necessarily track the index. The indices assume reinvestment of dividends and do not reflect deduction of any fees or expenses.
Please Note: (1) performance results do not reflect the impact of taxes; (2) It should not be assumed that account holdings will correspond directly to any comparative benchmark index; and, (3) comparative indices may be more or less volatile than your account holdings.
Please note: Indices are frequently updated and the returns on any given day may differ from those presented in this document
Economic, index, and performance information is obtained from various third party sources. While we believe these sources to be reliable Simon Quick Advisors LLC has not independently verified the accuracy of this information and makes no representation regarding the accuracy or completeness of information provided herein.
As of April 1st, 2022, Simon Quick Advisors LLC has changed private capital index providers from Cambridge Associates to Pitchbook Benchmarks.