
2022 concluded on a positive note, with both equities and fixed income generating positive performance during Q4, despite a challenging year overall. While Central Bank action has been the primary driver of volatility and price declines in 2022, a slowdown in the magnitude of rate hikes and growing expectations for a pivot in policy in 2023 helped to drive markets higher. The S&P 500 advanced 7.5% during Q4, while the Barclays US Agg Bond Index was up 1.8%.
The major market driver in Q4 was the growing expectation that central banks have been getting close to completing their task of raising rates to a sufficiently restrictive territory, with the hopes of rate cuts from the Fed in late 2023. This growing optimism was driven by continued declines in the year-over-year inflation rate, with the December inflation read at 7.1% vs. a high of 9.1% in May. The alleviation of supply chain bottlenecks alongside dropping energy prices have been the primary drivers of this decline, although housing rent rates have continued to climb. Current expectations are for inflation to continue to fall throughout 2023, but with growing calls for an impending US recession.
The Fed remained active in hiking rates during the fourth quarter, but notably slowed their magnitude of hikes in December. After utilizing 4 straight 75 basis point hikes from June through November, the Fed hiked rates by just 50 basis points in December. There was a growing sense of optimism that the level of rate hikes would slow to 25 basis points in early 2023 before pausing rate hikes altogether.
However, this has been somewhat tempered by a persistently tight labor market, which finished Q4 with US unemployment near all-time lows and wage growth above pre-COVID levels. Chairman Powell has repeatedly stressed the importance of seeing a slowdown in the labor market before looking to pivot monetary policy, and this continued strength could cause rates to stay higher for longer than the market currently expects. Additionally, while the Fed has raised rates by over 400 basis points in 2022, the majority of these hikes were backloaded meaning the true impact of higher rates may take time to be felt.
Another major theme for the quarter was the strong outperformance of international assets. The MSCI EAFE Index was up over 17% while the Global Agg Bond Index was up 4.5% as both European equities and fixed income outperformed. Additionally, local currencies strongly outperformed the US Dollar, with the US Dollar Index falling from a multi-decade high of $114 in late Q3 to $103 to end the year. Dire predictions of energy & food shortages for Europe & other countries reliant on Russian resources have so far been avoided this winter, helping to drive a strong recovery rally for the continent’s assets.
China made headlines in the quarter as well, helping to drive markets higher by hinting at plans to relax both zero-COVID policies and restrictions on real estate developer borrowing that have slowed their economy considerably in recent years. This has helped to further improve investor sentiment in both China & abroad, as China is a major consumer of commodities and has historically offered a countercyclical demand driver to developed economies.
Market Overview

Source: Bloomberg Barclays, MSCI; FY2021 as of 12/31/2021. For Equities & Fixed Income, Q4 2022 and YTD 2022 as of 12/31/2022. For Alternatives, Q4 2022 and YTD 2022 as of 11/30/2022.
2022 concluded with strong performance from equities & fixed income, with the S&P 500 up over 7.5% and the Barclays US Agg Bond Index up 1.8%. Expectations for pivots in Central Bank policy and the ensuing decline in rates drove performance on the quarter.
International Developed economies led the market rally in Q4, with the MSCI EAFE up over 17% and the MSCI EM up 9.7%. Overly bearish predictions for European energy supply did not come to materialize, and rumors of a Chinese reopening helped to drive this performance.
Rate sensitive sectors advanced on the quarter as positive correlation between stocks & bonds returned. High Yielding and International fixed income exposure outperformed as positive sentiment drove credit spreads narrower.
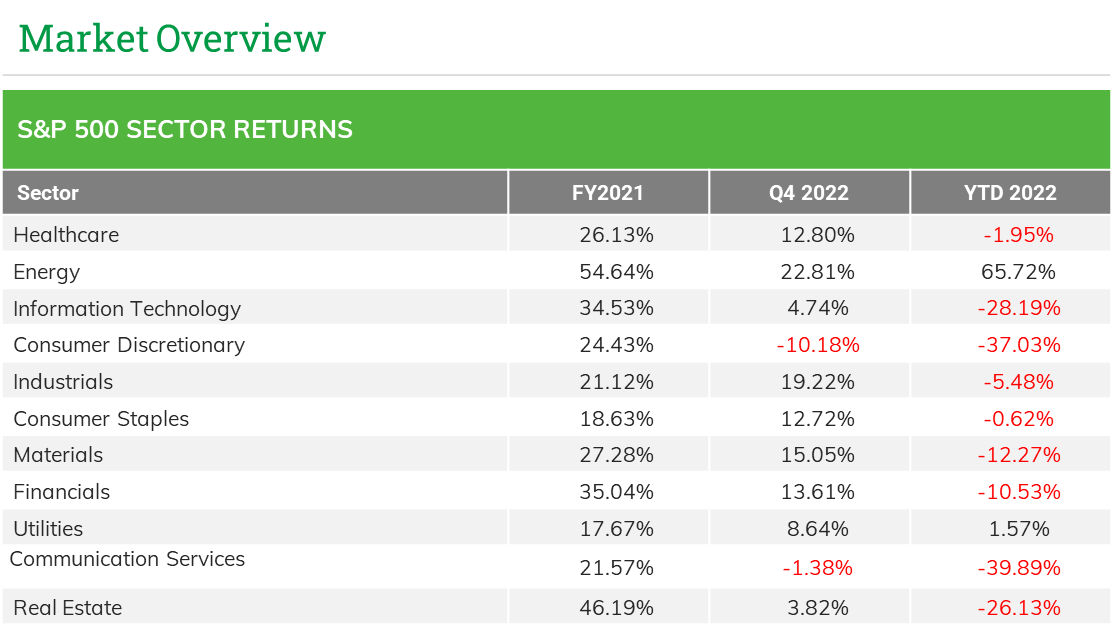
Source: Bloomberg; 2021 as of 12/31/2021;. Q4 2022 as of 12/31/2022. YTD 2022 as of 12/31/2022.
The cyclical sectors of energy, industrials, materials, and financials led performance during Q4 as positive investor sentiment drove equities. Energy returned as the market leader during the quarter, generating over 20%, despite spot crude prices falling over this time.
The growth-oriented sectors of Info Tech, Communication Services, and Consumer Discretionary continued to lead to the downside. Appetite for cyclical equities remained strong during the quarter, to the detriment of the more secularly-oriented growers.
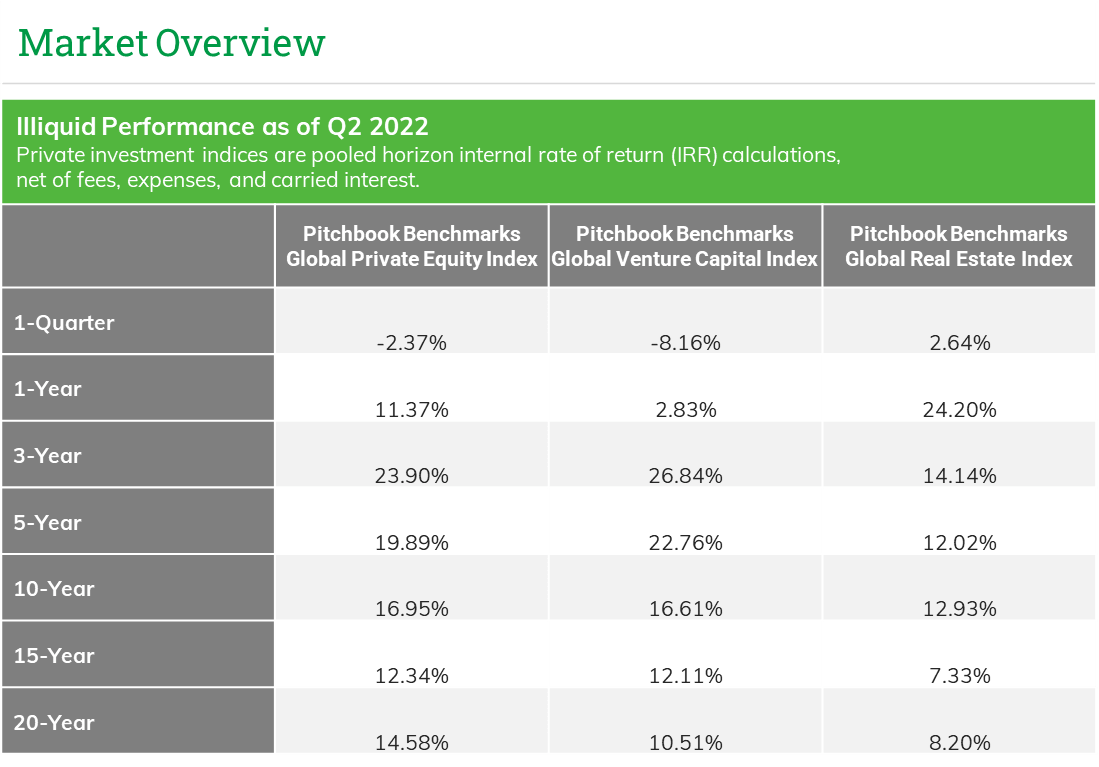
Source: Pitchbook Benchmarks as of 6/30/2022 Private investment index performance is reported on a 1-2 quarter lag PitchBook’s fund returns data is primarily sourced from individual LP reports, serving as the baseline for estimates of activity across an entire fund. For any given fund, return profiles will vary for LPs due to a range of factors, including fee discounts, timing of commitments and inclusion of co-investments. All returns data is net of fees and carry.
U.S. Equity Style & Market Capitalization Returns
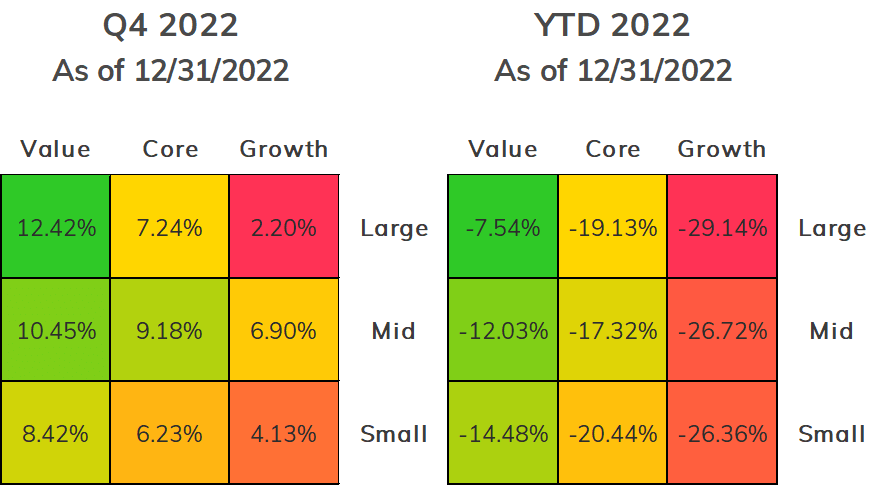
Source: Bloomberg; Q4 2022 as of 12/31/2022. YTD 2022 as of 12/31/2022.
During the fourth quarter, large cap value outperformed large cap growth by over 1000 basis points, one of the strongest quarters of outperformance for value dating back to the popping of the early 2000’s Tech Bubble. The Value factor continues to benefit from less interest rate sensitivity and overweight exposure to the cyclical sectors of energy, industrials, & materials.
On a year-to-date basis, Large Cap Value was the biggest winner as well. This was largely driven by the strong performance of Energy stocks which belong almost exclusively to the value indices.
Inflation Off Highs Yet Remains Elevated
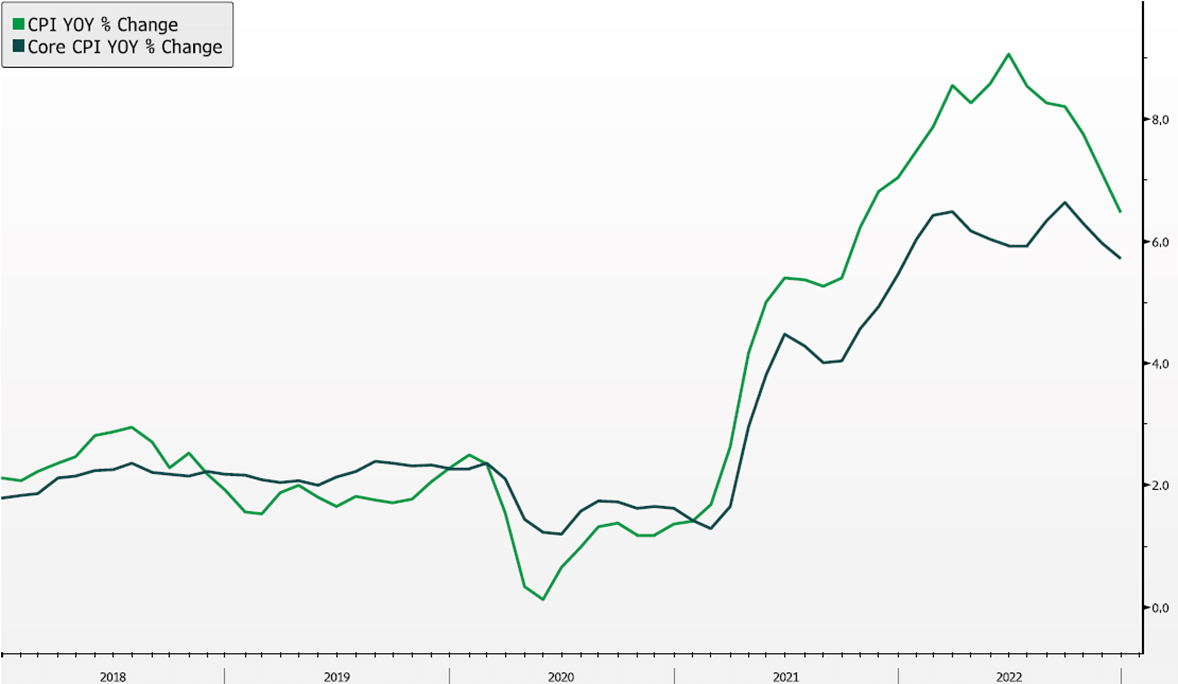
Source: Bloomberg
Inflation continued to moderate from multi-decade highs from both the headline and core measures. Headline inflation has fallen from a peak of 9.1% in May of 2022 to 6.5% as of December, driven by falling energy prices & alleviating supply chain bottlenecks.
Core inflation has remained a bit more elevated relative to peak levels as shelter & rent costs remain stubbornly elevated. Real-time new lease data has pointed to decreasing rents for new leases, but it will take time for this data to flow through CPI releases.
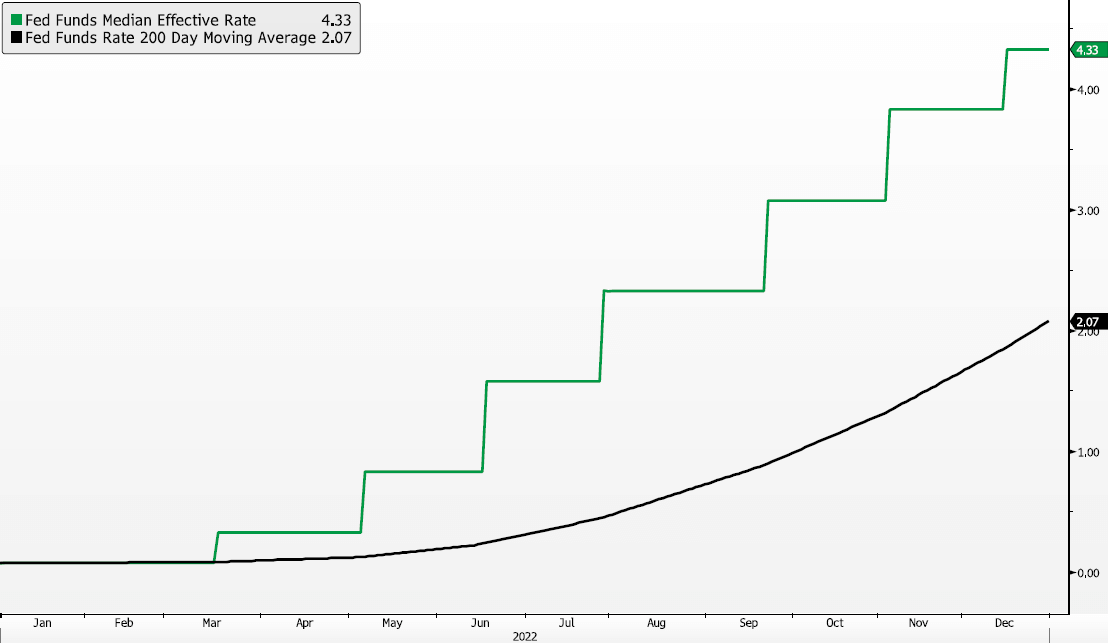
Fed Fund Rates
Source: Bloomberg
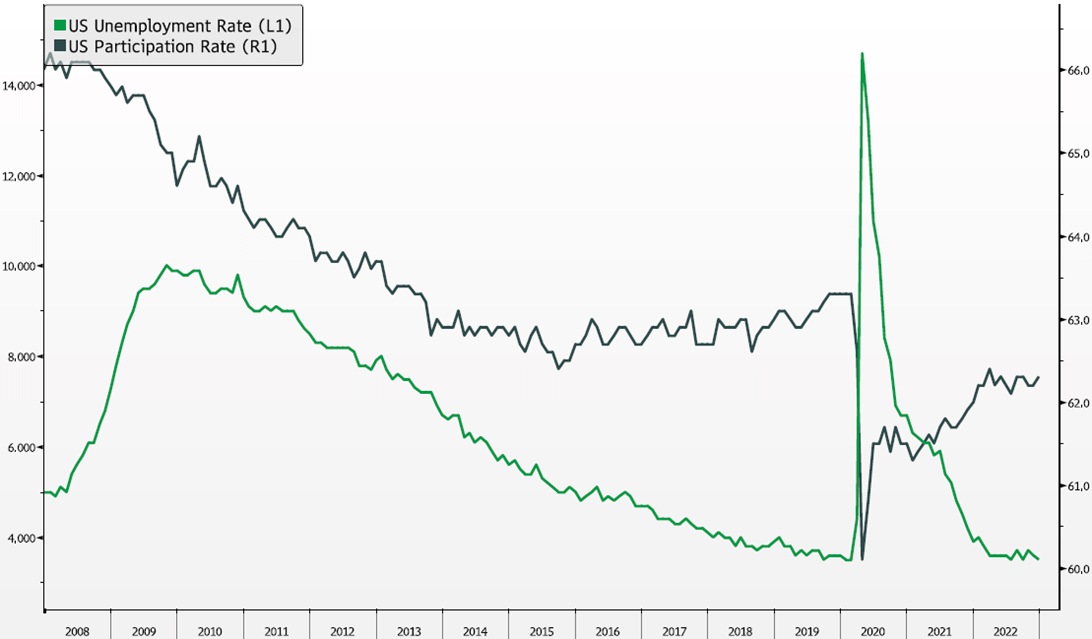
Labor Markets Remain Tight
In response to the continually elevated inflation, the Federal Reserve has consistently increased rates by a cumulative 400 basis points in 2022. However, the magnitude and pace of rate hikes increased throughout the year, leading to the moving average Federal Funds rate to end 2022 at just over 2%.
The impacts of monetary policy on the economy acts with a lag, and the above graph highlights that most tightening achieved by the Fed occurred in the back half of 2022. The impact of these higher rates will take time to be felt across the economy in 2023.
Source: Bloomberg
While inflation continues to contract off its highs, the labor market remains hot. The US unemployment rate has remained near multi-decade lows at 3.5% in December, as businesses are slow to layoff employees given how challenging hiring has been in recent years. The US labor force participation remains stubbornly below pre-COVID levels, driven by large waves of retirements since COVID in higher age cohorts.
The Fed has repeatedly commented on the importance of seeing a weakening in labor markets before contemplating pivoting monetary policy, and the continued strength of labor markets remains a headwind to this.
Source: Bloomberg
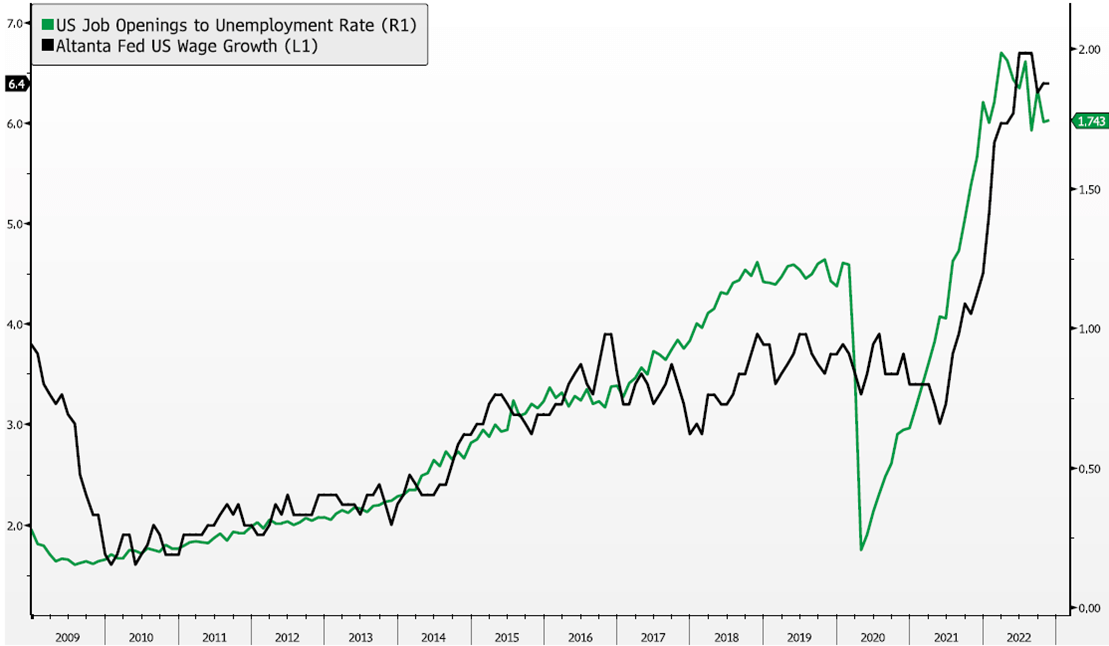
Other measures of the labor market appear overheated as well. The number of job openings in the US relative to the total number of unemployed persons remains highly elevated relative to pre-COVID levels. Close attention will be paid to this measure in 2023, as employers tend to reduce job openings before cutting positions altogether.
Wage growth also remains highly elevated to pre-COVID levels. Bringing this figure back in line with historic averages will be a key focus of the Fed’s in 2023 as the central bank looks to avoid signs of a wage price spiral.
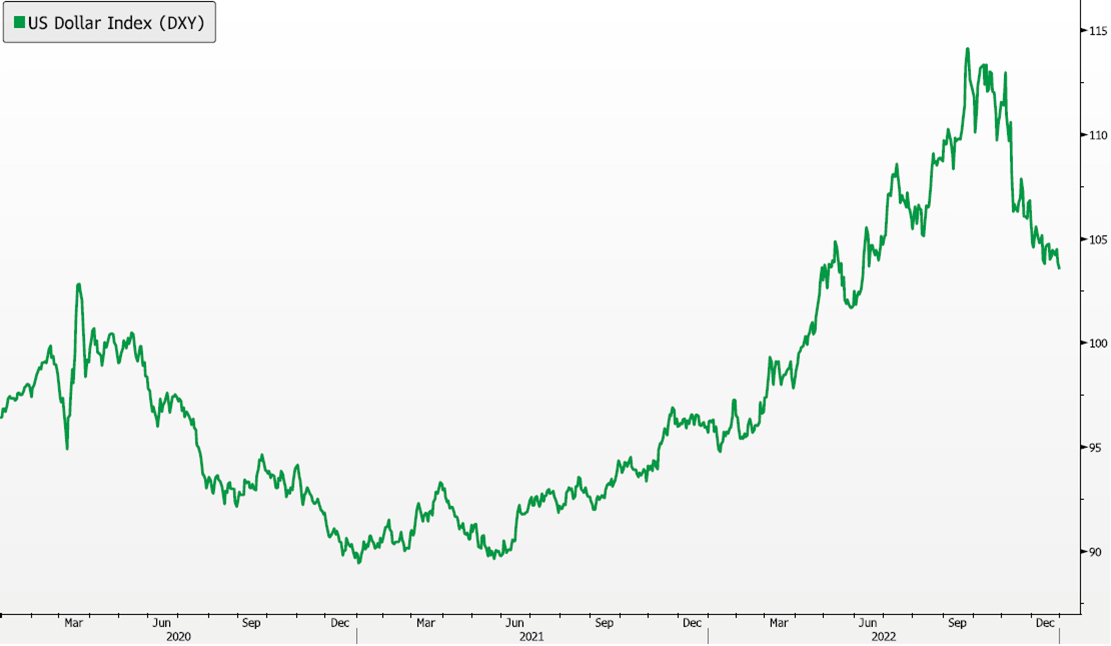
The US Dollar Gives Back Gains
Source: Bloomberg
After seeing strong price momentum since June of 2021, the US Dollar saw significant weakness in Q4. The Dollar benefited in 2021 and 2022 from strong domestic economic activity, geopolitical risk, and a particularly bleak outlook for Europe. However, the greenback gave back gains in Q4 as sentiment regarding international economies improved.
The weakening US Dollar helped to lead to strong outperformance for international assets during the quarter. Given its global importance, a strengthening US Dollar is associated with tighter financial conditions and the selloff in Q4 helped to offset this.
Equity & Bond Market Volatility
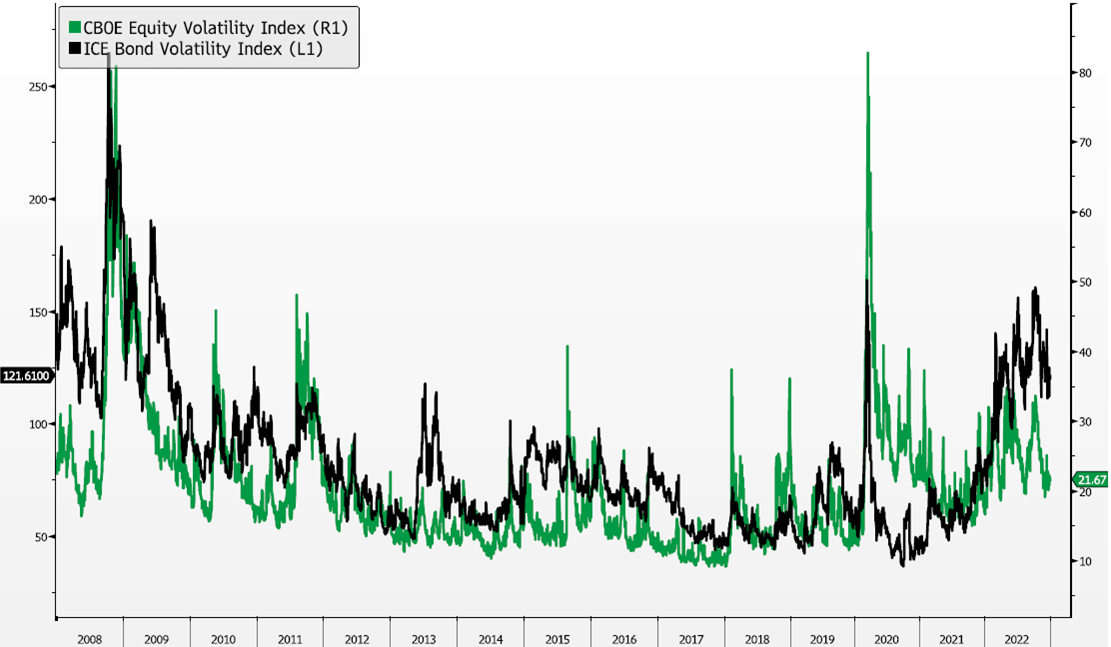
2022 finished as a highly unique year from a volatility perspective, with both bond & equity volatility remaining elevated throughout the year.
Bond volatility hovered at levels experienced during the height of the COVID pandemic for most of the year, putting pressure on funding markets globally. Expectations are for normalized bond volatility in 2023 as the Fed approaches their terminal rate.
Equity market volatility avoided the spikes seen in typical bear market selloffs, but the VIX finished the year at an average level of 24 vs. a historic average of 19.
Asset Class Analysis
Equities: Target-weight
Stocks have rebounded off the mid-October lows on the hopes of a slowing interest rate hiking cycle and better than expected third quarter earnings. While consumers continue to purchase into the holiday season and companies have been able to maintain margins, there is a risk of softening and lower guidance which hasn’t been meaningfully modeled into 2023 analysts’ forecasts. While we are long-term believers in equities, this late-year rally seems to be more technically driven than based on fundamentals, and thus we would be measured in adding on continued strength. While we’ve held off a recession this year, indications point to the likelihood of it occurring next year. We continue to increase our allocation to quality-oriented managers that should be able to better weather economic instability during this period. European energy and China COVID pressures keep us domestically focused. The Dollar remains strong versus other currencies but is coming off its highs, which has been a recent tailwind to international portfolios. We are willing to forego some of the short-term upside outside the US to be more defensively positioned overall.
Fixed Income: Target-weight
We have been steadily increasing duration and credit quality within our liquid fixed income allocation throughout the course of the year. While we may have been a little early, as the Fed has been even more hawkish than we anticipated, investment grade bonds now provide a yield that is multiples higher than what it was over the past several years. Furthermore, if a recession is on the horizon, owning higher quality assets that will benefit from a Fed pivot, and serve as a positive counterbalance to stocks seems warranted. We continue to emphasize alternative credit strategies that can generate meaningfully higher returns than those in liquid markets. These include private corporate and real estate lending and structured credit. We anticipate higher defaults than what we experienced in the past few years; however, higher returns from higher rates should more than compensate investors for that risk.
Liquid Alternatives: Target-weight
After several years of a relatively dry spell for returns, we think heightened volatility across asset classes is creating a ripe opportunity for diversified and long/short hedge funds. As traditional assets continue to remain under pressure, strategies that can take advantage of short-term pricing dislocations in a choppy market can generate more consistent returns through this challenging period. Furthermore, we have been adding residential real estate for its inflation-aligned properties as a complement to stock and bond portfolios. We are currently exploring opportunities within natural resources where years of underinvestment may drive higher prices for the commodity, as well as drive long-term capital investment into the industry, particularly as countries seek to control their own supply chains in the midst of geopolitical and COVID concerns.
Illiquid Alternatives: Target-weight
Private equity investments across venture, growth, and buy-out are currently seeing valuations adjust lower, similar to the price adjustments we are seeing for public markets that started earlier in the year. This will likely persist for the next few quarters and slow the pace of buy and sell activity in the near-term but will establish an attractive period to be an investor in private businesses for the long-term for those who have the capital to deploy. Secondaries and Distressed investing strategies may benefit well from a slowing economy as they tend to be opportunistic buyers of good assets at discounted valuations during a period of market uncertainty.
Disclaimer
The information, analysis, and opinions expressed herein are for general and educational purposes only. Nothing contained herein is intended to constitute legal, tax, accounting, securities, or investment advice nor an opinion regarding the appropriateness of any investment, nor a solicitation of any type.
Please remember that past performance may not be indicative of future results. Different types of investments involve varying degrees of risk, and there can be no assurance that the future performance of any specific investment, investment strategy, or product (including the investments and/or investment strategies recommended or undertaken by Simon Quick Advisors LLC), or any non-investment related content, made reference to directly or indirectly in this presentation will be profitable, equal any corresponding indicated historical performance level(s), be suitable for your portfolio or individual situation, or prove successful. Asset Allocation may be used in an effort to manage risk and enhance returns. It does not, however, guarantee a profit or protect against loss. Due to various factors, including changing market conditions and/or applicable laws, the content may no longer be reflective of current opinions or positions. Moreover, you should not assume that any discussion or information contained in this presentation serves as the receipt of, or as a substitute for, personalized investment advice from Simon Quick Advisors LLC. To the extent that a reader has any questions regarding the applicability of any specific issue discussed above to his/her individual situation, he/she is encouraged to consult with the professional advisor of his/her choosing. Investing in alternatives may not be suitable for all investors, and involves a high degree of risk. Many alternative investments are highly illiquid, meaning that you may not be able to sell your investment when you wish. Risk of alternative investments can vary based on the underlying strategies used.
Certain information contained herein may be “forward-looking” in nature. Due to various risks and uncertainties, actual events or results or the actual performance of the Fund may differ materially from those reflected or contemplated in such forward-looking information. As such, undue reliance should not be placed on such information. Forward-looking statements may be identified by the use of terminology including, but not limited to, “may,” “will,” “should,” “expect,” “anticipate,” “target,” “project,” “estimate,” “intend,” “continue” or “believe” or the negatives thereof or other variations thereon or comparable terminology.
Simon Quick Advisors LLC is neither a law firm nor a certified public accounting firm and no portion of the presentation content should be construed as legal or accounting advice. If you are a Simon Quick Advisors LLC client, please remember to contact Simon Quick Advisors LLC, in writing, if there are any changes in your personal/financial situation or investment objectives for the purpose of reviewing/evaluating/revising our previous recommendations and/or services. Simon Quick Advisors, LLC (Simon Quick) is an SEC registered investment adviser with a principal place of business in Morristown, NJ. Simon Quick may only transact business in states in which it is registered, or qualifies for an exemption or exclusion from registration requirements. A copy our written disclosure brochure discussing our advisory services and fees is available upon request. References to Simon Quick Advisors as being “registered” does not imply a certain level of education or expertise.
Historical performance results for investment indices and/or categories have been provided for general comparison purposes only, and generally do not reflect the deduction of transaction and/or custodial charges, the deduction of an investment management fee, nor the impact of taxes, the incurrence of which would have the effect of decreasing historical performance results. It should not be assumed that your account holdings correspond directly to any comparative indices. You cannot invest directly in an index.
Indices included in this report are for purposes of comparing your returns to the returns on a broad-based index of securities most comparable to the types of securities held in your account(s). Although your account(s) invest in securities that are generally similar in type to the related indices, the particular issuers, industry segments, geographic regions, and weighting of investments in your account do not necessarily track the index. The indices assume reinvestment of dividends and do not reflect deduction of any fees or expenses.
Please Note: (1) performance results do not reflect the impact of taxes; (2) It should not be assumed that account holdings will correspond directly to any comparative benchmark index; and, (3) comparative indices may be more or less volatile than your account holdings.
Please note: Indices are frequently updated and the returns on any given day may differ from those presented in this document
Economic, index, and performance information is obtained from various third party sources. While we believe these sources to be reliable Simon Quick Advisors LLC has not independently verified the accuracy of this information and makes no representation regarding the accuracy or completeness of information provided herein.
As of April 1st, 2022, Simon Quick Advisors LLC has changed private capital index providers from Cambridge Associates to Pitchbook Benchmarks.