

Let’s Meet, on Your Terms
No pressure, no obligations — just an open conversation about your goals.
2025 Q1 Market Update
Early in President Trump’s second term, trade wars have resurfaced as a key issue, triggering significant volatility in the financial markets.. As of this writing, the S&P 500 has narrowly avoided entering a bear market (defined by a 20% drop) as trade disputes have ratcheted up, particularly between the US & China. Through April 9th, the S&P 500 had dropped nearly 11% from the peak in mid-February and -7% YTD – including three of the worst consecutive down days in market history & one of the strongest days in market history as tariff headlines whipsaw.
S&P 500 Price Level
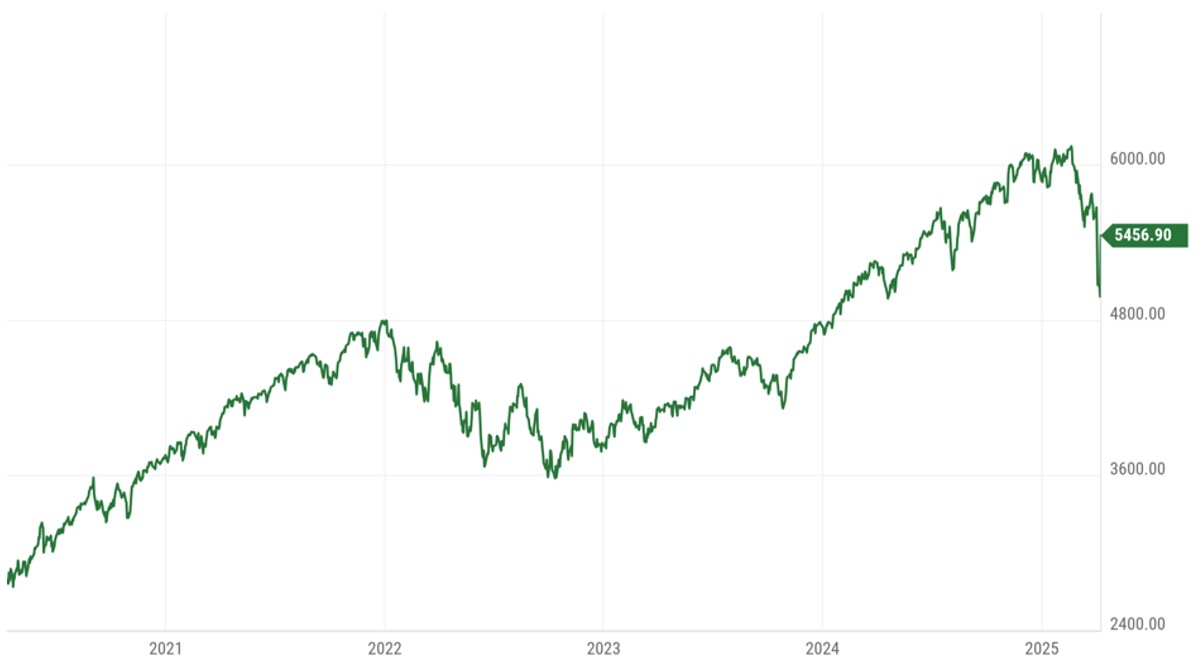
Source: YCharts
After equities soared following President Trump’s victory in the November Presidential election, investors have been disappointed by the lack of business-friendly policy that was expected to bolster the economy for the next four years. Markets were choppy in the first two months of 2025 as President Trump repeatedly threatened tariffs against a range of trading partners, notably Mexico & Canada, before walking back or punting on the implementation of the tariffs.
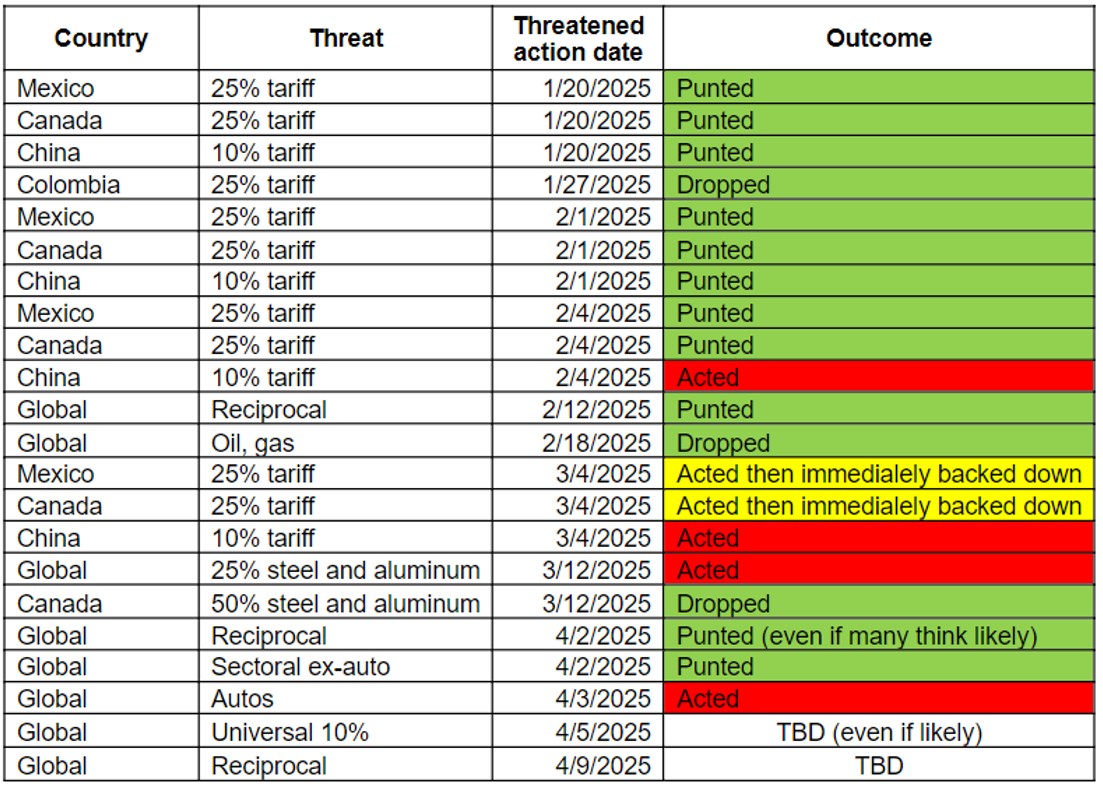
Source: Signum Global Advisors, Bloomberg
The market was unsure what to make of these threats, and a sense of complacency set in as many assumed this was another example of the ‘Art of the Deal’ negotiating tactics at work and threats would continue to be pared back. While US equities saw some selling pressure throughout the quarter, particularly the outperforming Technology & Magnificent 7 stocks that drove performance in recent years, the S&P was only down 4% in Q1. Outside of the US, equity performance was much more positive as capital rotated into much cheaper & previously underperforming international equities – notably China & Germany – resulting in the MSCI ACWI being down just about 1%. Geographic diversification was doing its job in the first quarter.
Q1 Market Performance
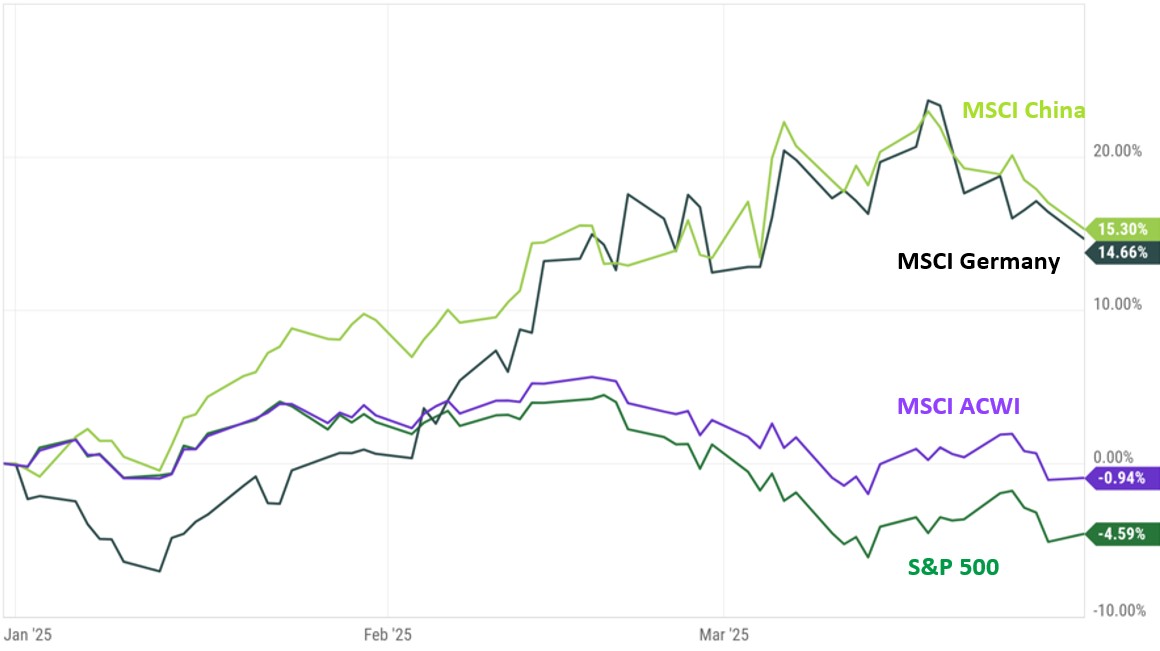
Source: YCharts
That brings us to April 2nd and the famed Liberation Day. After announcing earlier in Q1 that President Trump intended to implement reciprocal tariffs on trading partners, the market assumed that meant enacting tariffs on goods at the same rates that countries put on US goods coming through their borders. Assumptions were that the effective tariff rate would be raised from about 2% to somewhere around 10%. However, the President chose a more punitive calculation to determine tariff rates, taking instead the percentage of the trade deficit with each country and dividing that number by 2 to get to the tariff rate. This included tariff rates of 20% on the EU, 34% (initially) on China, 24% on Japan, 46% on Vietnam, and so on for over 60 trading partners. This brought the effective tariff rate to over 22% – significantly higher than the market had expected.
US Effective Tariff Rate Following Liberation Day
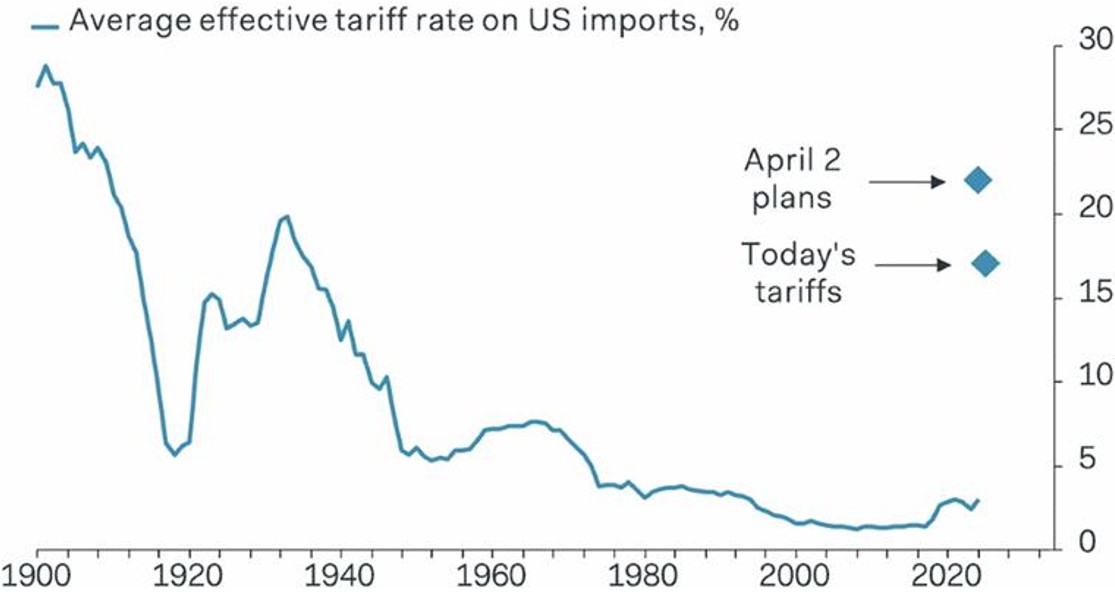
Source: Pantheon Macroeconomics, as of 4/9/2025
However, this tariff rate did not remain in effect for very long as President Trump delayed the implementation of reciprocal tariffs on all trading partners besides China for 90 days. A 10% baseline tariff rate has still gone into effect, and tit-for-tat tariff increases have resulted in 125% tariffs on Chinese goods coming into the US & 84% tariffs for US goods entering China. Market volatility has been dramatic over this time, clearly shown in equity markets, but also somewhat surprisingly in the bond market. Fixed income, designed to be the defensive portion of client portfolios, protected over the first few months of the year as yields fell in response to the expected slowdown in growth from tariffs. This bond rally continued initially after Liberation Day but has seen a V shaped selloff as treasuries were sold aggressively as global recession and economic destabilization concerns continued to grow. Bonds rallied alongside equities following the delay of reciprocal tariffs, but yields remain above the Liberation Day levels. Despite this, bonds remain positive on the year and would still be expected to protect portfolios in the event of a growth shock brought upon by a trade war. The market is pricing in 100 basis points of rate cuts as the Fed would be expected to look through the one-time price increases associated with tariffs.
10-Year US Treasury Yield
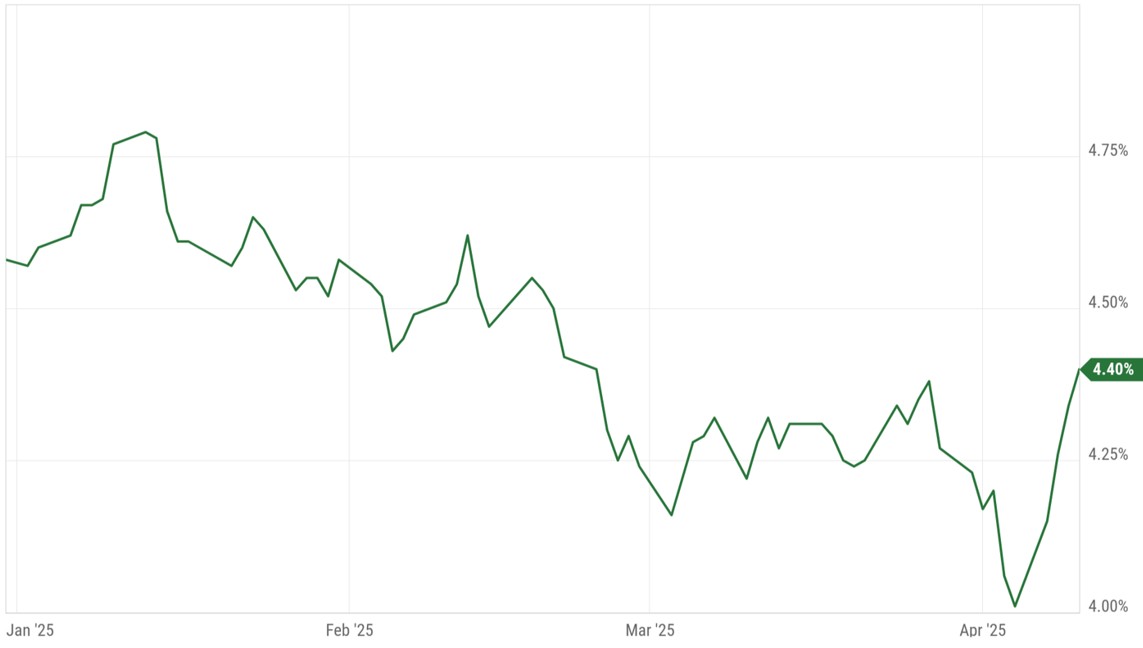
Source: YCharts, as of 4/10/2025
While the current market environment has been highly volatile and the go-forward outlook is uncertain, it is important to remain focused on the long-term. Avoiding highly emotional investment decisions during periods of volatility is critical to long-term performance, and we remain believers that market timing is a zero-sum game. The chart below reviews 150 years of market performance and highlights that over the long term, equities have been consistent drivers of wealth, even when there is volatility in the short term. This time period covers two World Wars, multiple global epidemics, a Civil War, a Great Depression, and 30% tariff rates. Staying rooted in this long-term view is critical in periods like this. While nobody knows what the severity of the selloff will look like, or how long a recovery will take, we remain convicted in diversified portfolios tailored to client-specific risk profiles.
30-Year & 5-Year Annualized Real Return of US Equities
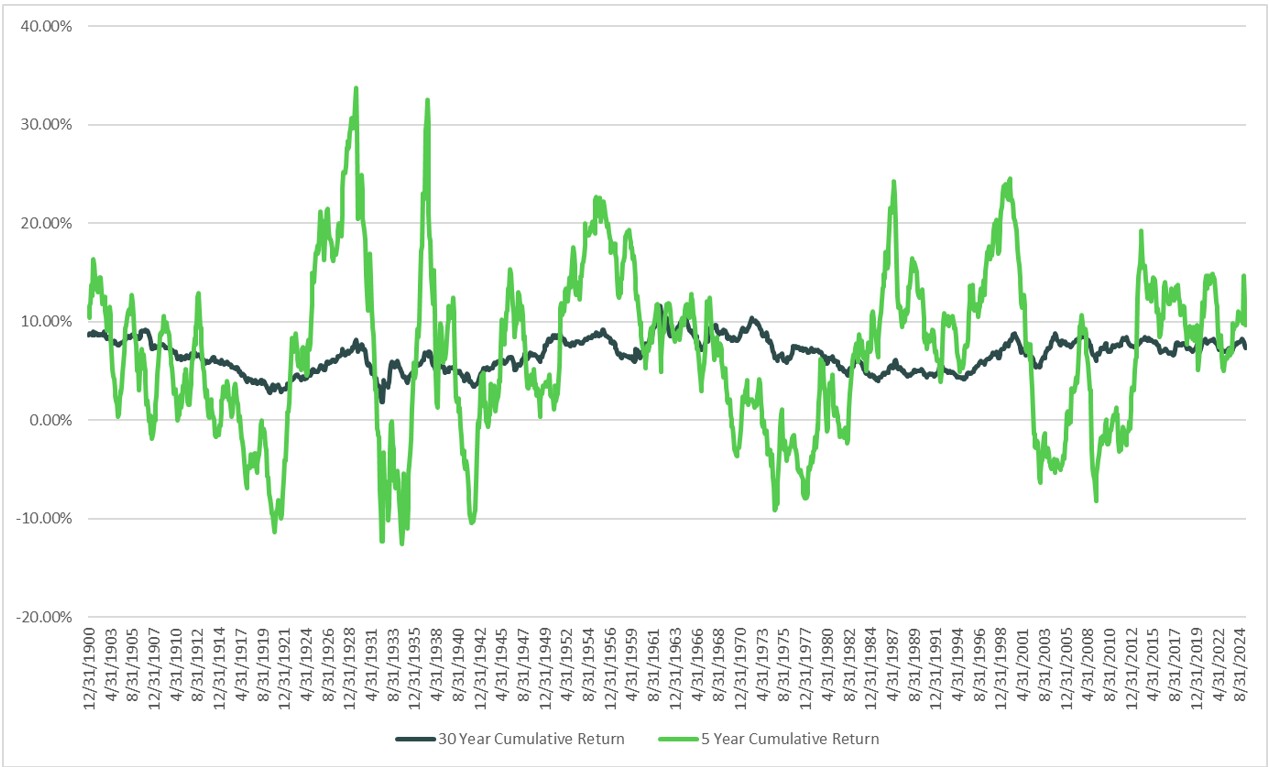
Source: Shiller Data
Asset Class Analysis
Equities: Target-weight
The size and scale of Trump’s tariff announcement caught politicians, business executives, and investors off-sides, causing equity markets to fall in early April, only to see plans largely walked back and enactment delayed just a week later. While it now appears that the final outcome of import levies will be more modest, overall business confidence continues to wane, alongside a weakening consumer base. Recession risk has risen and equity valuations have adjusted lower commensurately. Despite market weakness, stocks don’t look “cheap” as earnings expectations likely need to be adjusted lower. While we would look to be opportunistic buyers in periods of heightened volatility, we skew towards large-cap defensive equities and would further diversify into international equities as capital flows away from the recent domestic tech leaders.
Fixed Income: Target-weight
Treasuries initially rallied on trade war concerns in a flight to safety, but have since widened out meaningfully in consideration of what prolonged tensions may do to the fiscal deficit and US Dollar debasement. We continue to elevate the credit quality across our traditional fixed income as well as yield-seeking allocations. We are positioned to be modestly shorter-duration than the broader index to mitigate interest rate volatility. While we expect the Central Bank to cut rates further if necessary, longer-maturity instruments may not benefit much.
Liquid Alternatives: Target-weight
Hedge Funds: We continue to expect overall hedge fund allocations to be risk mitigants in this period of heightened volatility. Hedged, multi-strategy managers have overall protected capital, albeit equity long-short funds are experiencing drawdowns to a lesser degree than broad equity markets. We continue to add exposures to uncorrelated strategies. In periods of equity and bond volatility, we expect this strategy to deliver more consistent returns.
Real Estate: The asset class has fallen out of favor with rising rates and looming debt maturities, despite their long-term inflation-aligned characteristics. Given depressed values, we are seeking opportunistic investment strategies in both debt and equity that can offer enhanced return potential without taking material risk.
Illiquid Alternatives: Target-weight
A trade war will likely weigh on equity markets and depress potential exit valuations for businesses. This concern has delayed M&A and IPO activity, and will likely keep companies private for longer. This will cause a delay on the monetization of incumbent businesses, but may allow for attractive entry points for fresh capital. We continue to steadily invest in buy-out and venture opportunities for the long-term, but with the conservatism of a potentially slower-growing economy for the medium-term. Opportunistic, shorter-term investments may generate attractive IRRs in periods of market dislocation, even in less liquid assets.
Disclaimer
The information, analysis, and opinions expressed herein are for general and educational purposes only. Nothing contained herein is intended to constitute legal, tax, accounting, securities, or investment advice nor an opinion regarding the appropriateness of any investment, nor a solicitation of any type.
Please remember that past performance may not be indicative of future results. Different types of investments involve varying degrees of risk, and there can be no assurance that the future performance of any specific investment, investment strategy, or product (including the investments and/or investment strategies recommended or undertaken by Simon Quick Advisors LLC), or any non-investment related content, made reference to directly or indirectly in this presentation will be profitable, equal any corresponding indicated historical performance level(s), be suitable for your portfolio or individual situation, or prove successful. Asset Allocation may be used in an effort to manage risk and enhance returns. It does not, however, guarantee a profit or protect against loss. Due to various factors, including changing market conditions and/or applicable laws, the content may no longer be reflective of current opinions or positions. Moreover, you should not assume that any discussion or information contained in this presentation serves as the receipt of, or as a substitute for, personalized investment advice from Simon Quick Advisors LLC. To the extent that a reader has any questions regarding the applicability of any specific issue discussed above to his/her individual situation, he/she is encouraged to consult with the professional advisor of his/her choosing. Investing in alternatives may not be suitable for all investors, and involves a high degree of risk. Many alternative investments are highly illiquid, meaning that you may not be able to sell your investment when you wish. Risk of alternative investments can vary based on the underlying strategies used.
Certain information contained herein may be “forward-looking” in nature. Due to various risks and uncertainties, actual events or results or the actual performance of the Fund may differ materially from those reflected or contemplated in such forward-looking information. As such, undue reliance should not be placed on such information. Forward-looking statements may be identified by the use of terminology including, but not limited to, “may,” “will,” “should,” “expect,” “anticipate,” “target,” “project,” “estimate,” “intend,” “continue” or “believe” or the negatives thereof or other variations thereon or comparable terminology.
Simon Quick Advisors LLC is neither a law firm nor a certified public accounting firm and no portion of the presentation content should be construed as legal or accounting advice. If you are a Simon Quick Advisors LLC client, please remember to contact Simon Quick Advisors LLC, in writing, if there are any changes in your personal/financial situation or investment objectives for the purpose of reviewing/evaluating/revising our previous recommendations and/or services. Simon Quick Advisors, LLC (Simon Quick) is an SEC registered investment adviser with a principal place of business in Morristown, NJ. Simon Quick may only transact business in states in which it is registered, or qualifies for an exemption or exclusion from registration requirements. A copy our written disclosure brochure discussing our advisory services and fees is available upon request. References to Simon Quick Advisors as being “registered” does not imply a certain level of education or expertise.
Historical performance results for investment indices and/or categories have been provided for general comparison purposes only, and generally do not reflect the deduction of transaction and/or custodial charges, the deduction of an investment management fee, nor the impact of taxes, the incurrence of which would have the effect of decreasing historical performance results. It should not be assumed that your account holdings correspond directly to any comparative indices. You cannot invest directly in an index.
Indices included in this report are for purposes of comparing your returns to the returns on a broad-based index of securities most comparable to the types of securities held in your account(s). Although your account(s) invest in securities that are generally similar in type to the related indices, the particular issuers, industry segments, geographic regions, and weighting of investments in your account do not necessarily track the index. The indices assume reinvestment of dividends and do not reflect deduction of any fees or expenses.
Please Note: (1) performance results do not reflect the impact of taxes; (2) It should not be assumed that account holdings will correspond directly to any comparative benchmark index; and, (3) comparative indices may be more or less volatile than your account holdings.
Please note: Indices are frequently updated and the returns on any given day may differ from those presented in this document
Economic, index, and performance information is obtained from various third party sources. While we believe these sources to be reliable Simon Quick Advisors LLC has not independently verified the accuracy of this information and makes no representation regarding the accuracy or completeness of information provided herein.
As of April 1st, 2022, Simon Quick Advisors LLC has changed private capital index providers from Cambridge Associates to Pitchbook Benchmarks.